Revolutionizing Data Visualization: The Power of AI Pie Charts
In today's data-driven business landscape, visualizing information has become vital among various visualization techniques. Pie charts have stood the test of time as a powerful means of conveying complex data in a simple format. Yet, artificial intelligence has brought forth a new era in data visualization. It revolutionized the way businesses and individuals create and interpret pie charts.
This article delves into the transformative power of AI pie charts. It will explore their growing significance in modern business. It will also highlight how they became an indispensable tool for the decision-making process.
Part I: The Rise of AI in Data Visualization
In recent years, the integration of artificial intelligence technologies has transformed various industries. When it comes to data visualization, AI has emerged as a game-changer. It offers unprecedented accuracy, efficiency, and insights. This section explores the rise of AI in data visualization and its impact on creating pie charts.
The Integration of AI Technologies in Various Industries
AI technologies have permeated every sector of business. AI has been a valuable tool in finance and healthcare marketing and manufacturing. Machine learning algorithms have become powerful tools for analyzing vast amounts of data. Deep neural networks and natural language processing also helped in extracting meaningful patterns. That's why industries leveraged AI to gain valuable insights and make data-driven decisions.
How AI Enhances the Accuracy and Efficiency of Data Visualization
Data visualization plays a crucial role in simplifying complex information. It also helps in appealingly presenting data. By harnessing AI, data visualization tools can analyze datasets and identify trends. It also helps in generating pie charts with enhanced accuracy and precision.
AI algorithms also excel in handling large datasets and identifying outliers. It can also discern patterns that might not be immediately clear to humans. This leads to more informed decision-making and a deeper understanding of data.
Exploring the Applications of AI in Creating Pie Charts
AI has opened up new possibilities for creating and enhancing pie charts. That leads to making them even more powerful and insightful. AI algorithms can analyze data inputs and categorize information. It can also determine the appropriate proportions for each slice of the chart. Furthermore, AI pie chart generators can identify data anomalies. They ensure that the resulting visualizations represent accurate underlying information.
AI can also enable interactive and dynamic pie charts that adapt in real time as data changes. These dynamic visualizations allow users to explore different scenarios. This then leads users to drill down into specific categories. It also helps users to gain a deeper understanding of the relationships within the data.
Part II: The Power of Mockitt AI - Chart Generator
Mockitt AI - Chart Generator from Wondershare Mockitt combines artificial intelligence with data visualization powerfully. It helps to simplify and streamline the creation of pie charts. Mockitt AI offers a seamless experience in creating appealing and informative pie charts. Leveraging AI algorithms, Mockitt takes pie chart creation to the next level. It automates tedious tasks and provides intelligent suggestions for accuracy and efficiency.

Key Features of Mockitt AI - Chart Generator
Check out the features that make Mockitt AI – Chart Generator a powerful tool:
· AI-powered automation for simplified and streamlined pie chart creation
· Automatic analysis of data inputs to generate accurate proportions for each category
· Interactive elements such as tooltips and animations for dynamic and engaging pie charts
· Real-time data synchronization and automatic updates for dynamic visualizations
· Intelligent suggestions for improving data quality and accuracy
· Collaborative features for seamless teamwork and sharing of pie charts
· Export options for sharing or embedding pie charts in various formats (e.g., PNG, SVG, PDF)
· Continual updates and enhancements to ensure optimal performance and user experience
Pros
Take a look at the advantages that Mockitt AI - Chart Generator offers below:
· The AI-powered automation streamlines the process, saving users time and effort.
· The AI algorithms ensure that the generated pie charts represent accurate data. This reduces the risk of errors or inaccuracies.
· Mockitt AI provides a wide range of customization options. It allows users to create appealing and branded pie charts.
· The tool's interactive elements enable users to create dynamic and engaging pie charts. This advantage leads to exploration and deeper understanding.
· User-friendly interface for easy navigation and intuitive chart creation process
Cons
Below are the drawbacks of using Mockitt AI – Chart Generator:
· Users may need some time to familiarize themselves with Mockitt AI's features.
· Mockitt AI can indeed provide suggestions for improving data quality. But the tool's effectiveness is still dependent on the accuracy of the input data.
How To Use Mockitt AI - Chart Generator for Creating Pie Charts
Mockitt AI - Chart Generator is a powerful program for making graphs and charts of all kinds. Here are the simple steps you need to take to learn how to use this function:
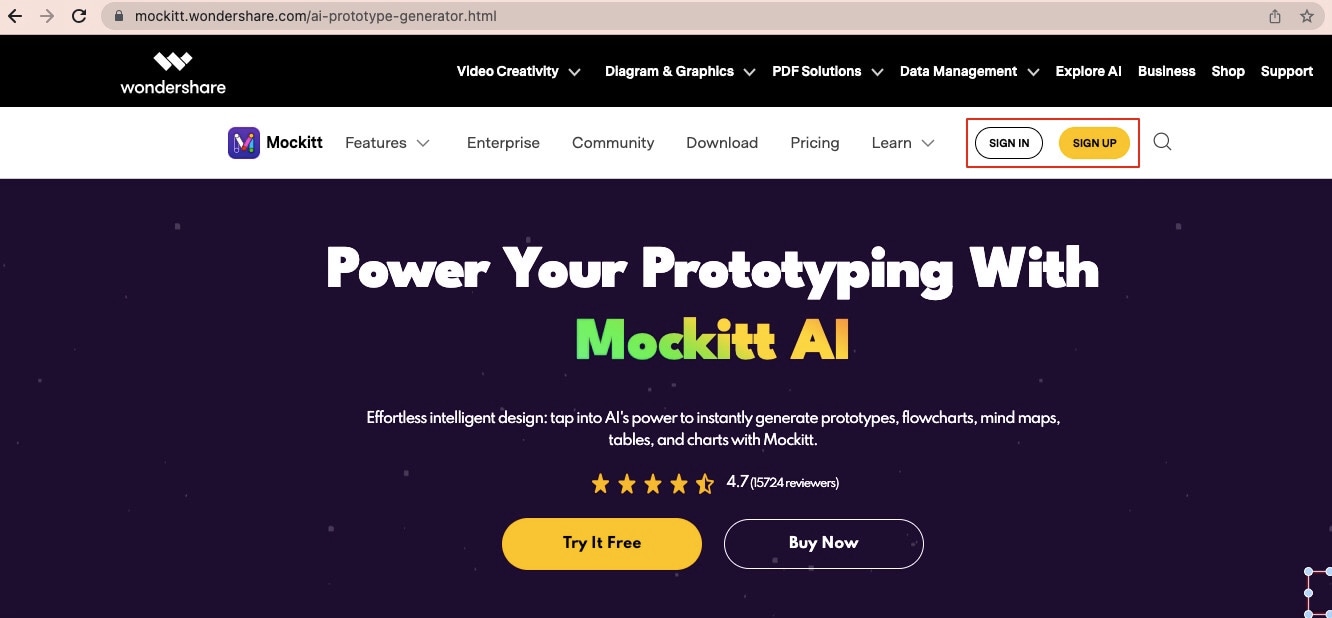
Step 1: Launch a web browser on your computer and navigate to the Wondershare Mockitt AI website. Create an account, or log in if you have one already. You can use your Google, Facebook, Twitter, or Apple ID to sign up.
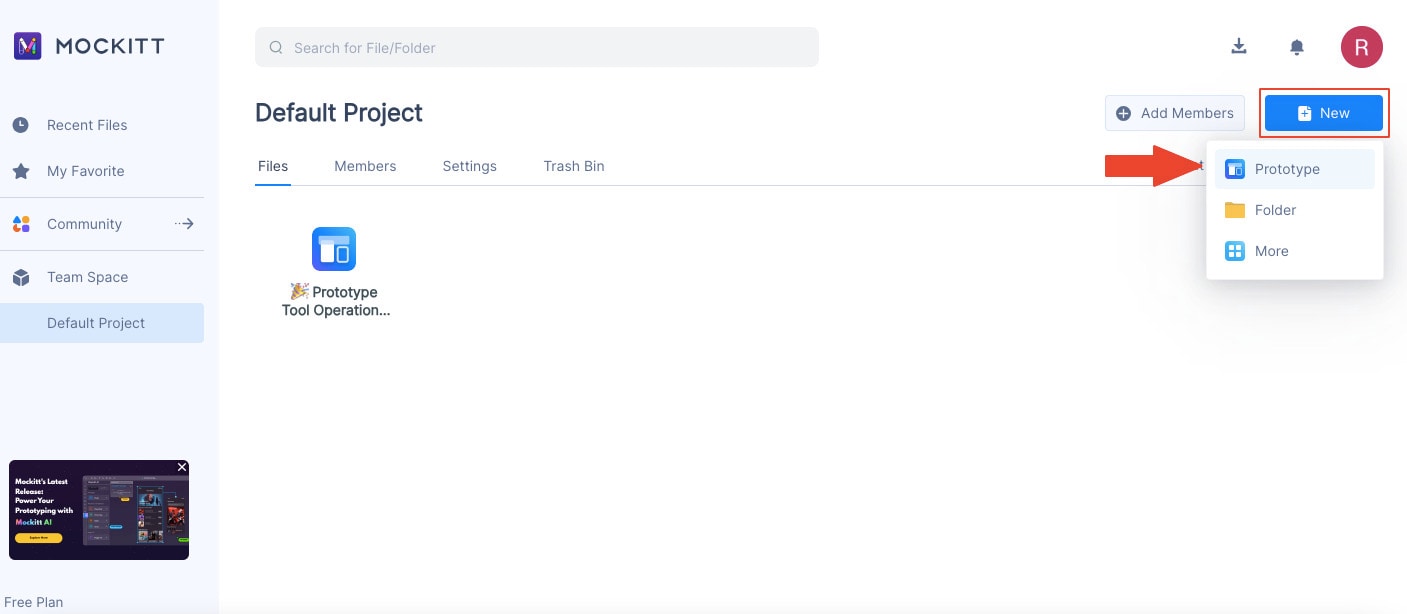
Step 2: Navigate to + New, found in the top-right corner of the Mockitt interface. Choose Prototype from the resulting drop-down menu.
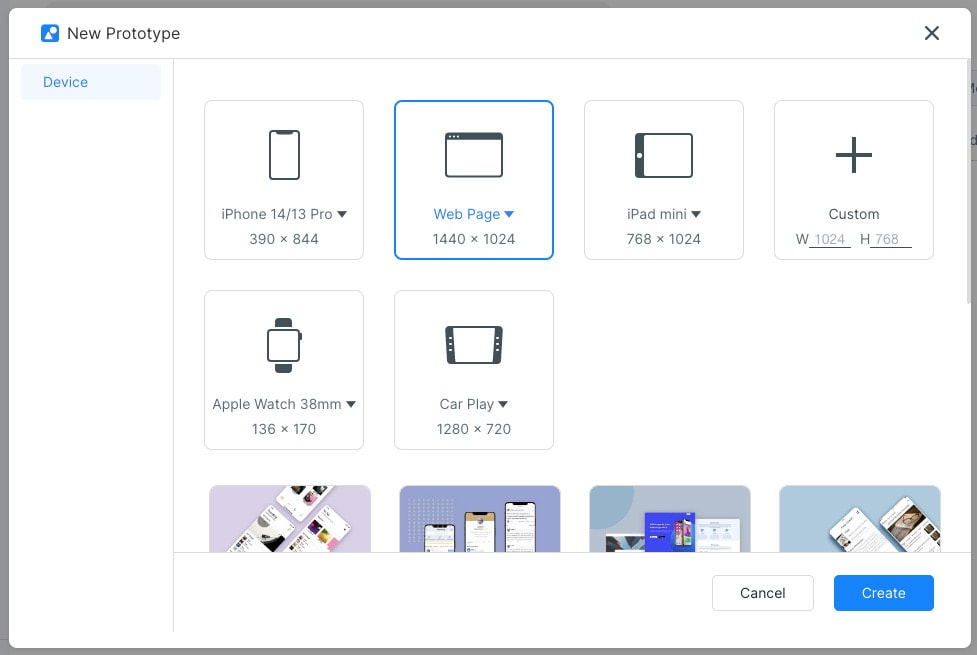
Step 3: Select the Device type from the New Prototype dialog box. When you finish the operation, click Create.
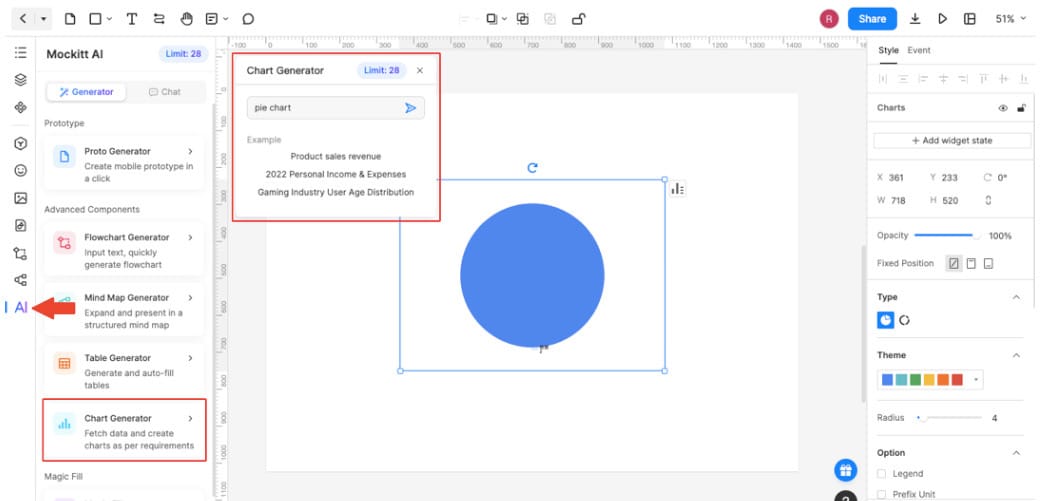
Step 4: You will then go to your New Project page. Navigate to the AI function at the navigation pane's bottom left. Click the Chart Generator option to reveal its dialog box. Enter your desired prompt in the text box, then hit the "Send" icon.
Step 6: Move forward with modifying your project with the help of Mockitt's many features. Once done, click the Export button at the screen's bottom right to save your project.
Part III: Advantages and Applications of AI-Powered Pie Charts
This section explores the advantages of AI algorithms in data visualization. It will delve into their role in identifying patterns from complex datasets and discuss the practical applications of AI-generated pie charts across industries.
Enhanced Accuracy and Precision in Data Visualization Through AI Algorithms
AI algorithms excel in handling large datasets and analyzing complex patterns. This enables them to enhance the accuracy and precision of data visualization. By automating the process, AI eliminates human error and ensures reliable results. AI algorithms can identify outliers and confirm data integrity. It also provides intelligent suggestions to improve data quality.
The Role of AI in Identifying Patterns and Insights From Complex Datasets
Complex datasets often contain hidden patterns. It may also include insights that may not be immediately evident to human observers. AI algorithms can uncover these hidden patterns and provide valuable insights. AI can identify correlations, trends, and outliers that might go unnoticed.
Practical Applications of AI-Generated Pie Charts Across Industries and Domains
The applications of AI-generated pie charts cover various industries and domains:
· Finance. AI-powered pie charts enable financial institutions to visualize and analyze financial data. This includes budget allocation, revenue breakdown, and expense categorization. They lead to better financial planning and decision-making.
· Marketing. AI pie charts help marketers understand market segmentation and campaign performance metrics. This opens up targeted marketing strategies and effective resource allocation.
· Healthcare. AI-generated pie charts aid in visualizing patient data, disease prevalence, and treatment outcomes. They facilitate evidence-based decision-making, resource allocation, and epidemiological analysis.
· Sales. AI pie charts assist teams in visualizing pipelines, customer distribution, and product performance. They enable sales forecasting, territory management, and identifying growth opportunities.
· Education. AI-powered pie charts support educators in visualizing student performance. They also help in learning analytics and curriculum analysis. They enable personalized learning approaches and identify areas for improvement.
The advantages of AI-powered pie charts are not limited to these industries alone. It extends to various domains, including logistics, manufacturing, research, and more.
Conclusion
With AI-powered pie charts, businesses can optimize resource allocation and identify new opportunities. The advancements in AI technologies will continue to drive innovation in data visualization. AI-generated pie charts allow for more accurate and dynamic visual representations. No one can overstate the benefits and significance of AI-powered pie charts cannot.
With Mockitt AI - Chart Generator, businesses can unlock the true potential of their data. It can also help them navigate the complexities of the modern business landscape. The future of data-driven decision-making lies in the hands of AI. Embracing its capabilities is key to staying ahead in a data-rich world.
