The Best AI Chart and Graph Generators in 2024
Charts and graphs are significant in business, education, and other aspects of human life. They are used to present data more understandably. This way, people can easily consume data by visualizing it through the shapes and lines in a chart or graph.
However, these charts can sometimes take work to make. People may have difficulty choosing which form of a chart or graph is best for their data. Or some people are unfamiliar with how to create these informative visuals. This is where AI comes in.
In this article, you will see the magic of AI tools, which can now make charts and graphs for you. A section will also be dedicated to practical tips on maximizing these AI tools, so keep reading.

Part 1. Top 7 AI Chart and Graph Generators
There are several AI tools in the market, and it can be overwhelming to find the right tool. This is why this section will recommend several AI charts and graph generators you can choose from. Be sure to try them out and assess the best for you.
Wondershare Mockitt
Mockitt is a prototyping tool designed to help users create visually engaging and functional website prototypes. It offers various features such as interactive elements, buttons, and more. All in all, these features come together to create a program that’s both intuitive and easy to use.
Recently, Wondershare equipped Mockitt with powerful AI features. Check out the new features that can help you generate tables, charts, and graphs:
· Flowchart Generator: Create professional flowcharts effortlessly with the Flowchart Generator. Provide your prompts, and watch as it generates a visually appealing flowchart that you can seamlessly incorporate into your prototypes. Streamline your design process and communicate ideas effectively.
· Table Generator: Designing tables has never been easier. The Table Generator lets you quickly create tables with just a few simple steps. Whether you need to present information or organize data, this tool covers you. Integrate the tables into your prototypes effortlessly and enhance the clarity and structure of your designs.
· Chart Generator: Say goodbye to manual data entry! The Chart Generator automatically creates a chart that you can use. The only thing you need to do is to input your data. Present your data in a visually captivating way that grabs attention and enhances understanding.
|
|
|
OS Availability |
|
|
Pros |
|
|
Cons |
|
Generating Charts and Graphs With Mockitt AI
To start creating your charts and graphs with the program, follow the steps below:
Step 1: Download, install, and launch Mockitt.
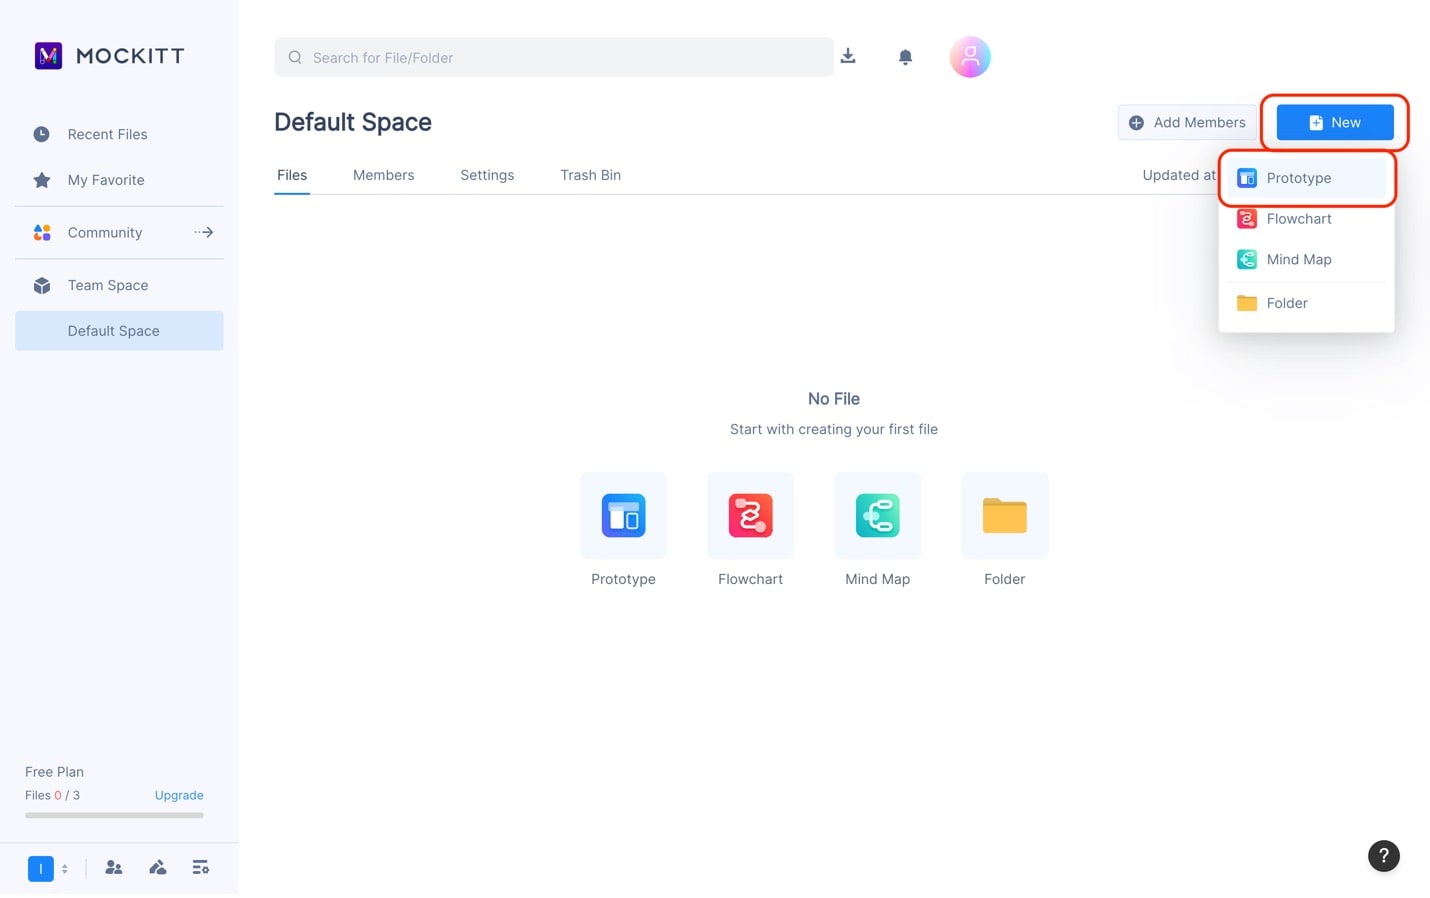
Step 2: Click +New and then Prototype on the app’s homepage.
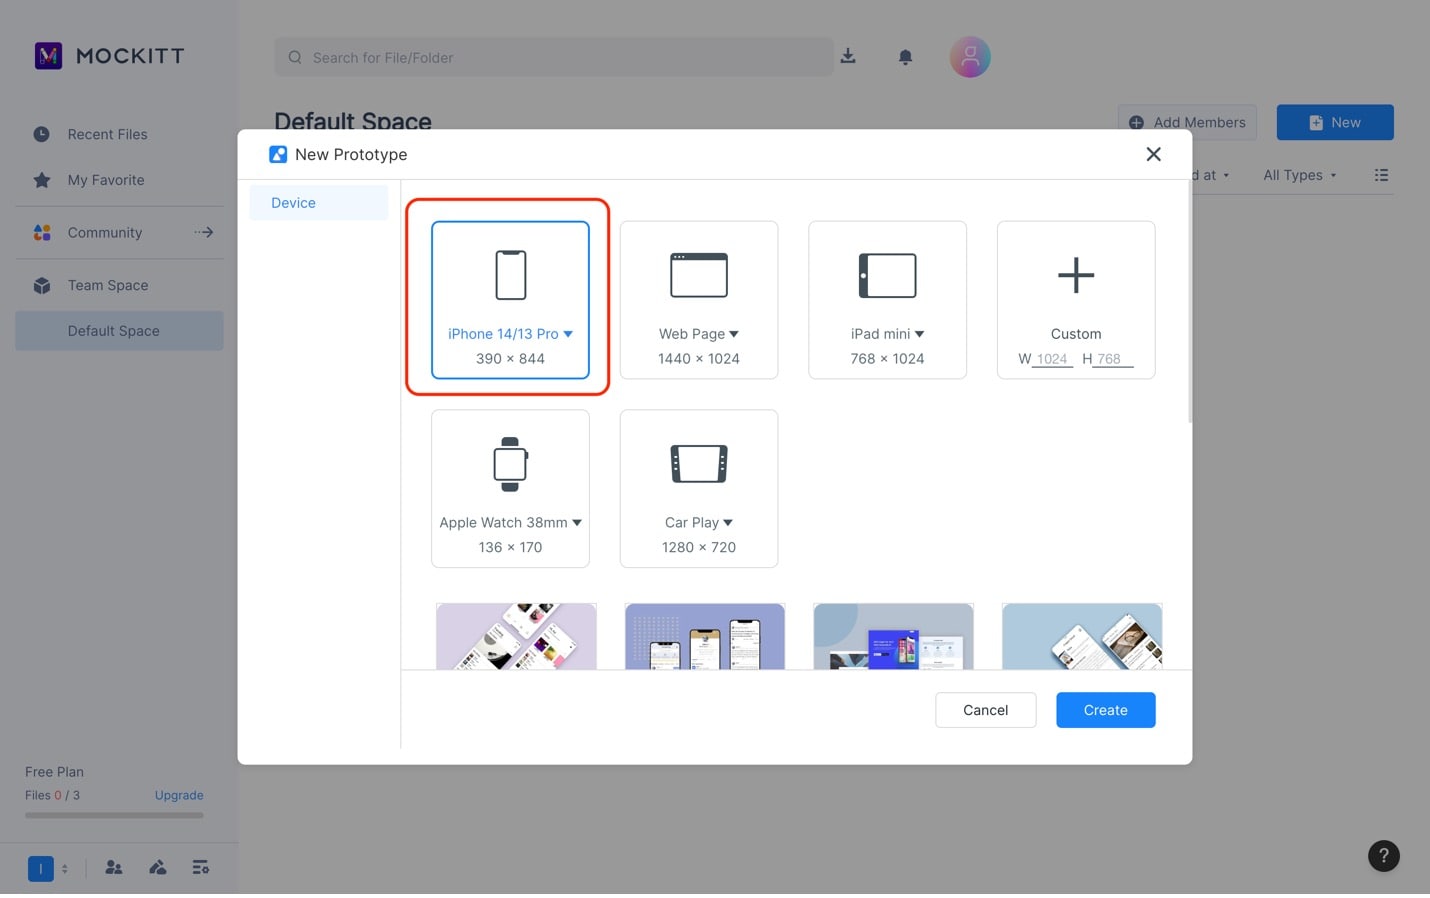
Step 3: Choose any device sizing template that you want to use.
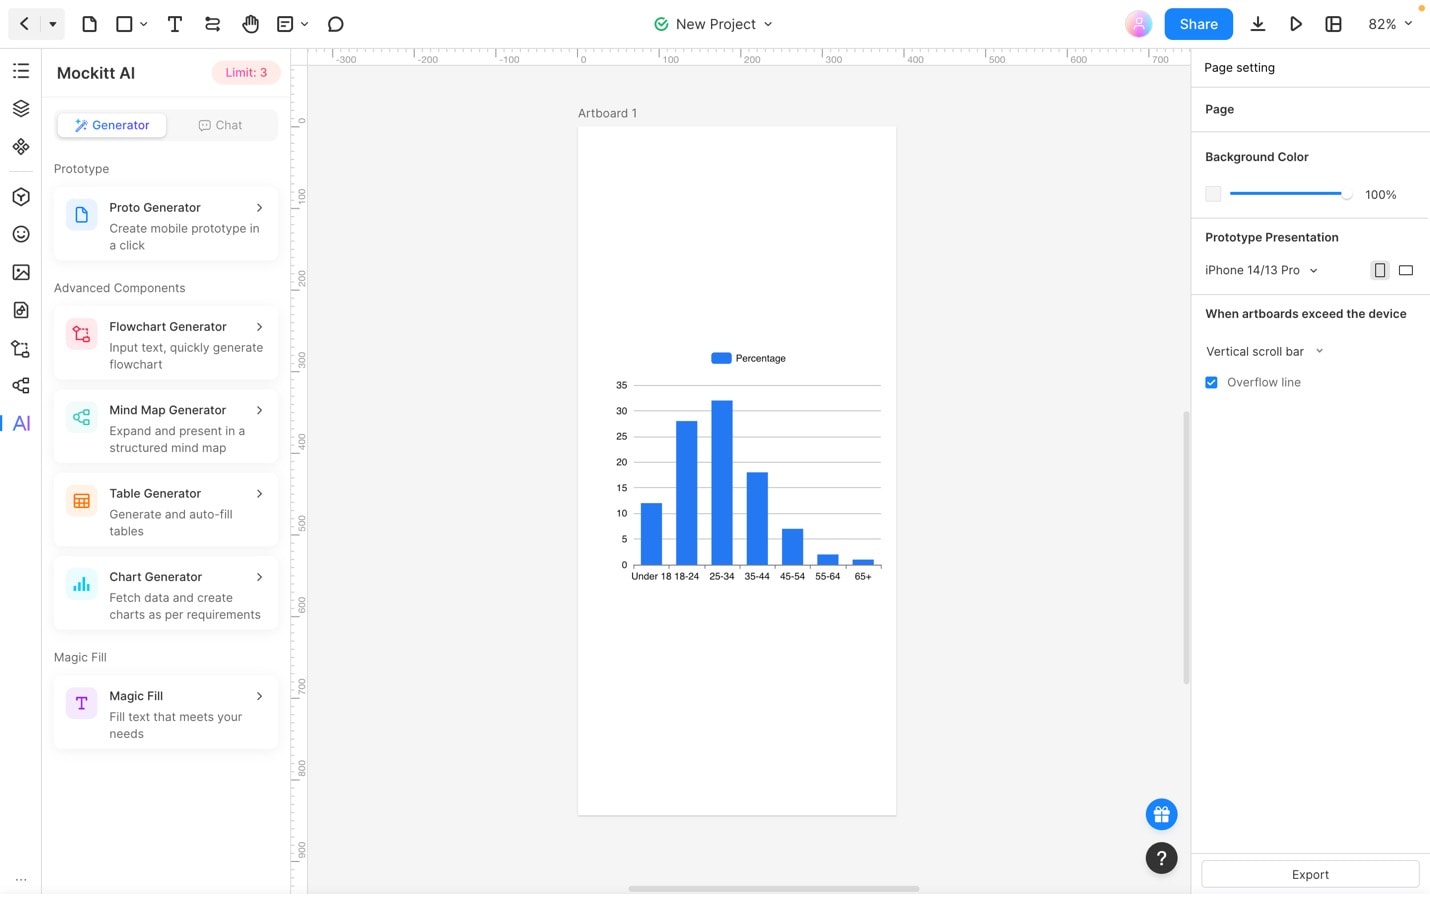
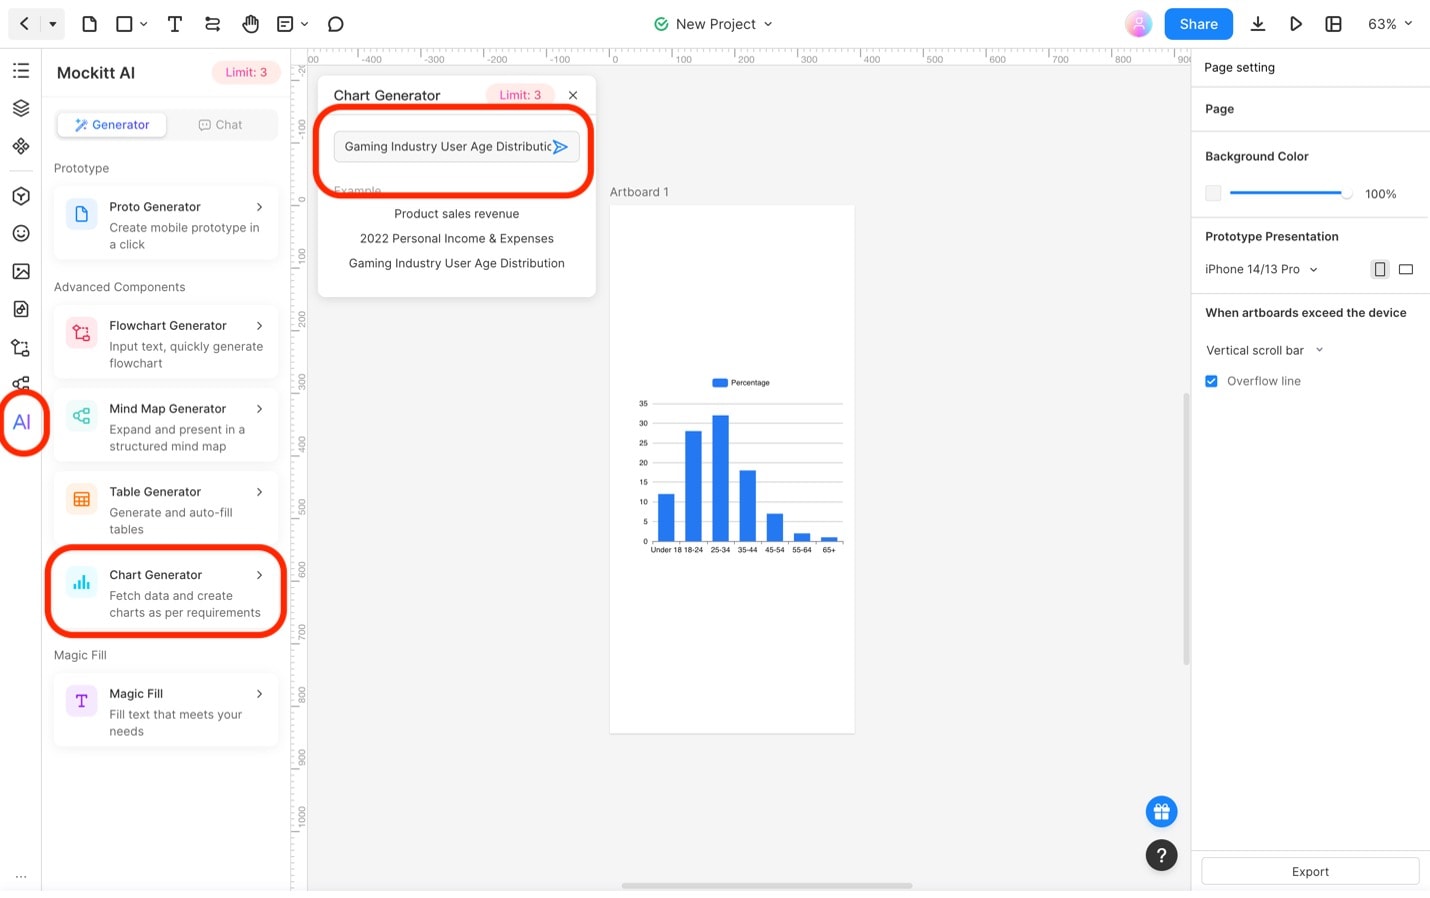
Step 4: Click AI on the left toolbar, then click Chart Generator. Type in what you need on the appearing text box, or use the AI suggestions. Wait for the AI to generate your chart.
Step 5: Click the generated chart. Then, click the Edit button that will appear beside it.
Edit the data as needed on the appearing menu.
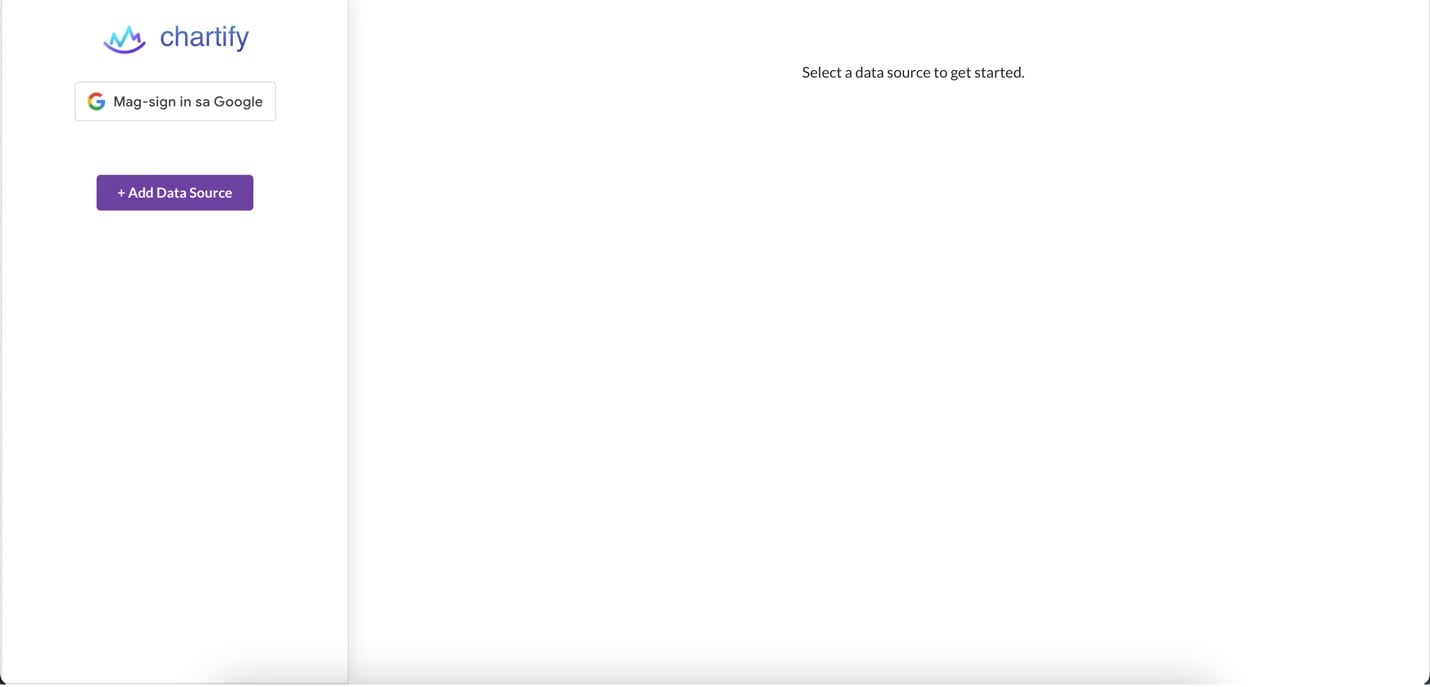
Chartify
Chartify provides a new way to present your data. It’s an automatic charting tool that creates beautiful charts from your data files. Upload or connect your files from online drives; the app will automatically chartify them. It’s a convenient tool that can help you generate charts without the hassle of typing in data again.
|
Pricing |
|
|
OS Availability |
|
|
Pros |
|
|
Cons |
|
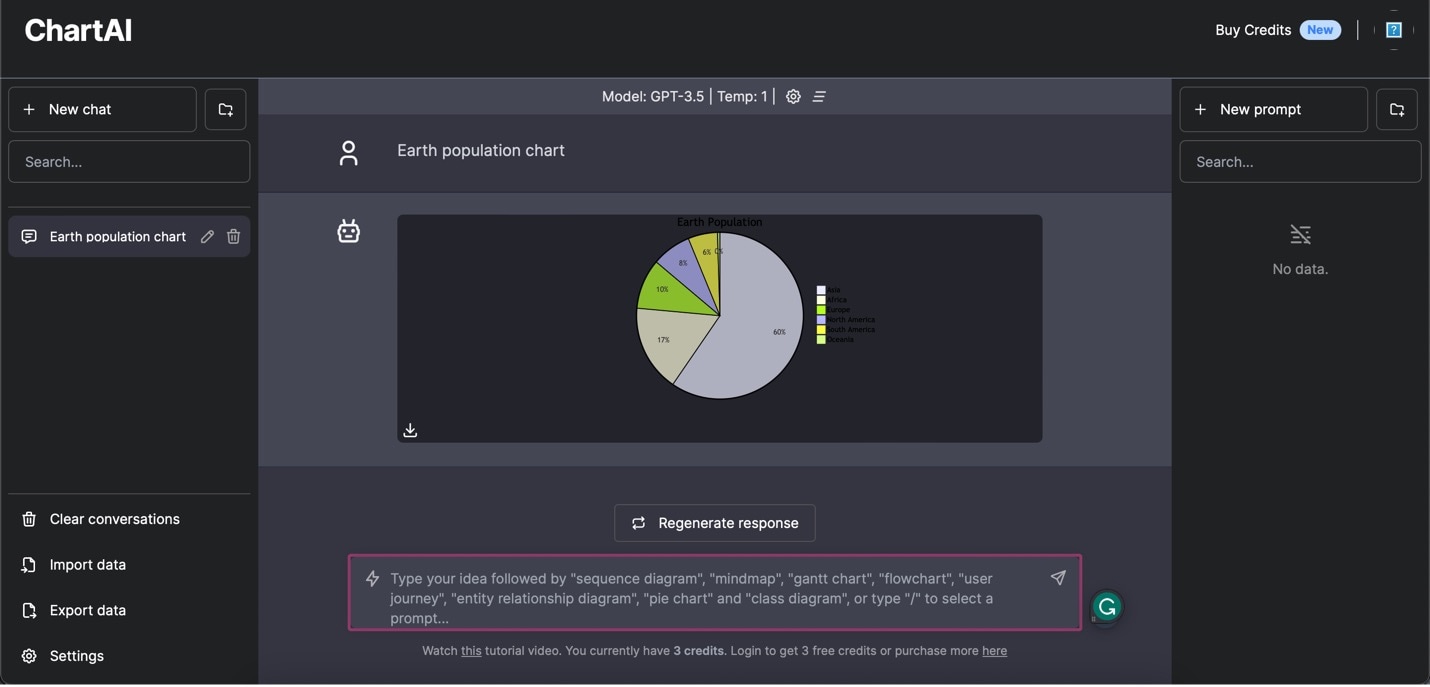
ChartAI
ChartAI is a popular website that provides unique tools for showing data in visual forms. Whether new to data analysis or an experienced pro, you can easily make beautiful charts and graphs using its simple interface. Almost everything in this app is done through a chatbot, so explaining what you want is easy. You can even import and export data straight from the website.
|
Pricing |
|
|
OS Availability |
|
|
Pros |
|
|
Cons |
|
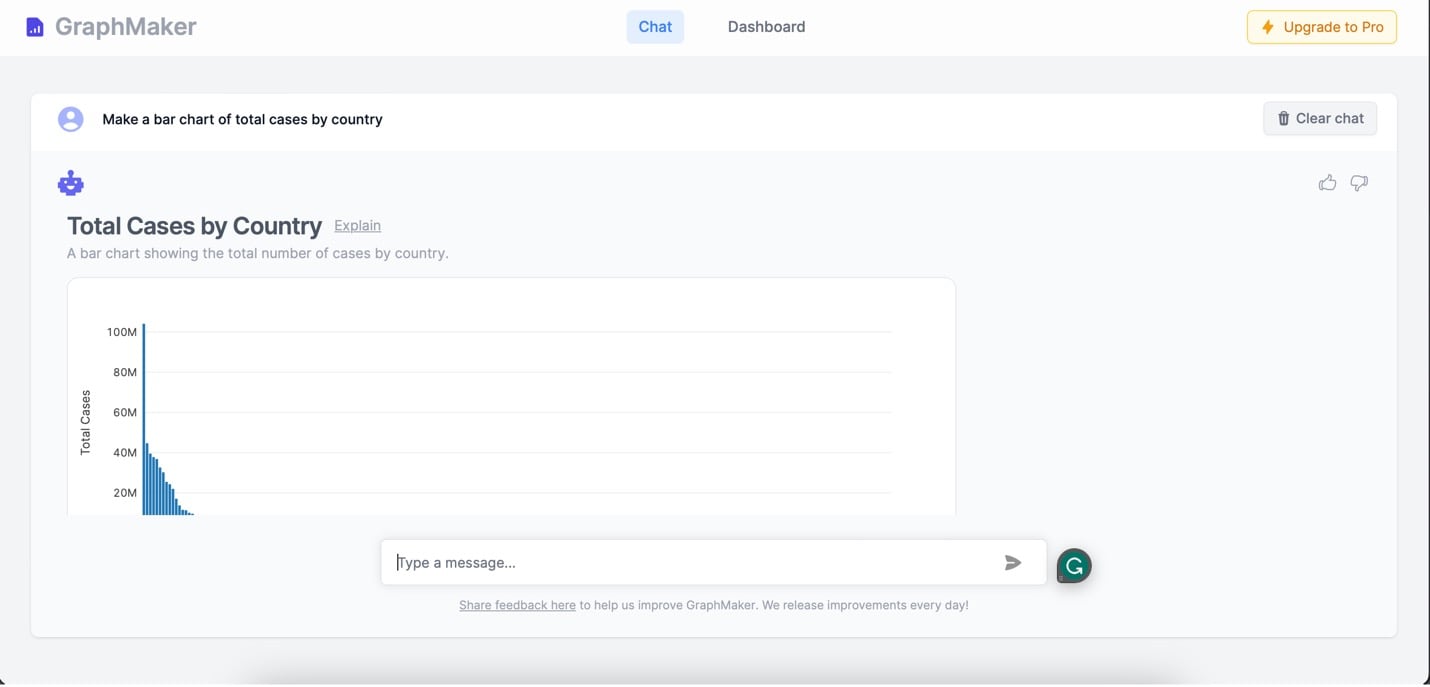
GraphMaker
GraphMaker is another chatbot-based graph maker that makes it especially easy to generate charts and graphs. It has several stored data, but you can upload several file types for the AI to process. Since it uses a chatbot, it’s easy to ask for specifics from the AI.
|
Pricing |
|
|
OS Availability |
|
|
Pros |
|
|
Cons |
|
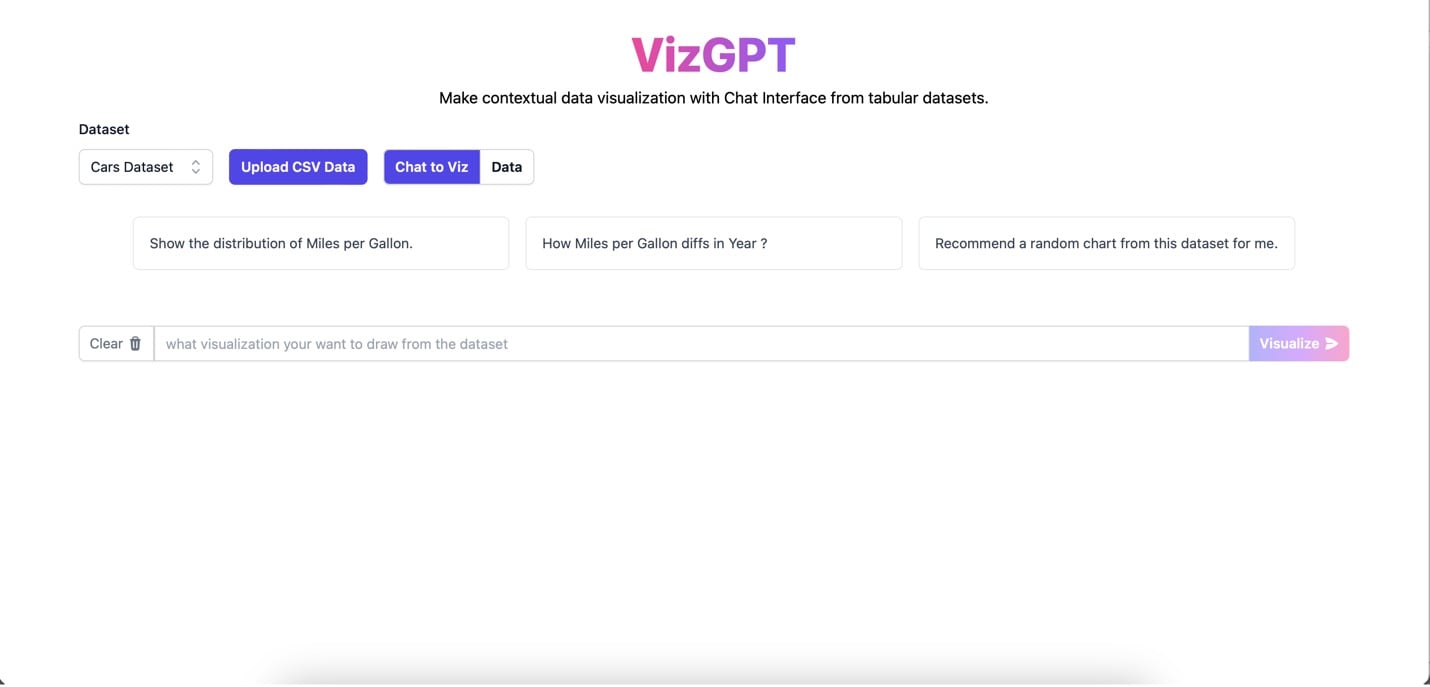
VizGPT
VizGPT is an AI app that understands you. It doesn’t only ask for your data, but it asks for what you want. If you are unfamiliar with CSV files or other data forms, you can chat with their chatbot to let it understand what you need. It’s a versatile tool that’s used to generate beautiful charts.
|
Pricing |
|
|
OS Availability |
|
|
Pros |
|
|
Cons |
|
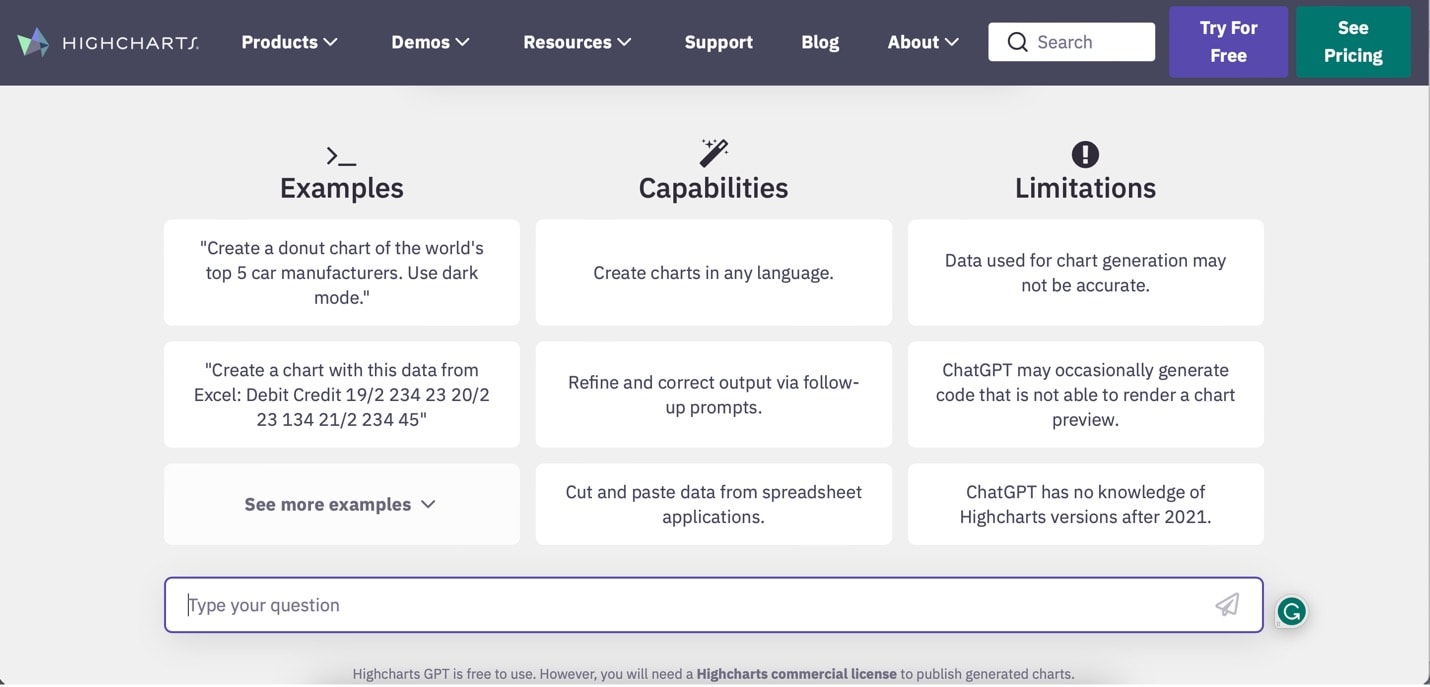
Highcharts GPT
Highcharts GPT is a GPT-powered charting tool that creates charts based on user input. Highcharts, a popular charting library, makes it so you know it’s reliable. It makes it easy to create beautiful graphs, even for beginners. It’s available on several platforms.
|
Pricing |
|
|
OS Availability |
|
|
Pros |
|
|
Cons |
|
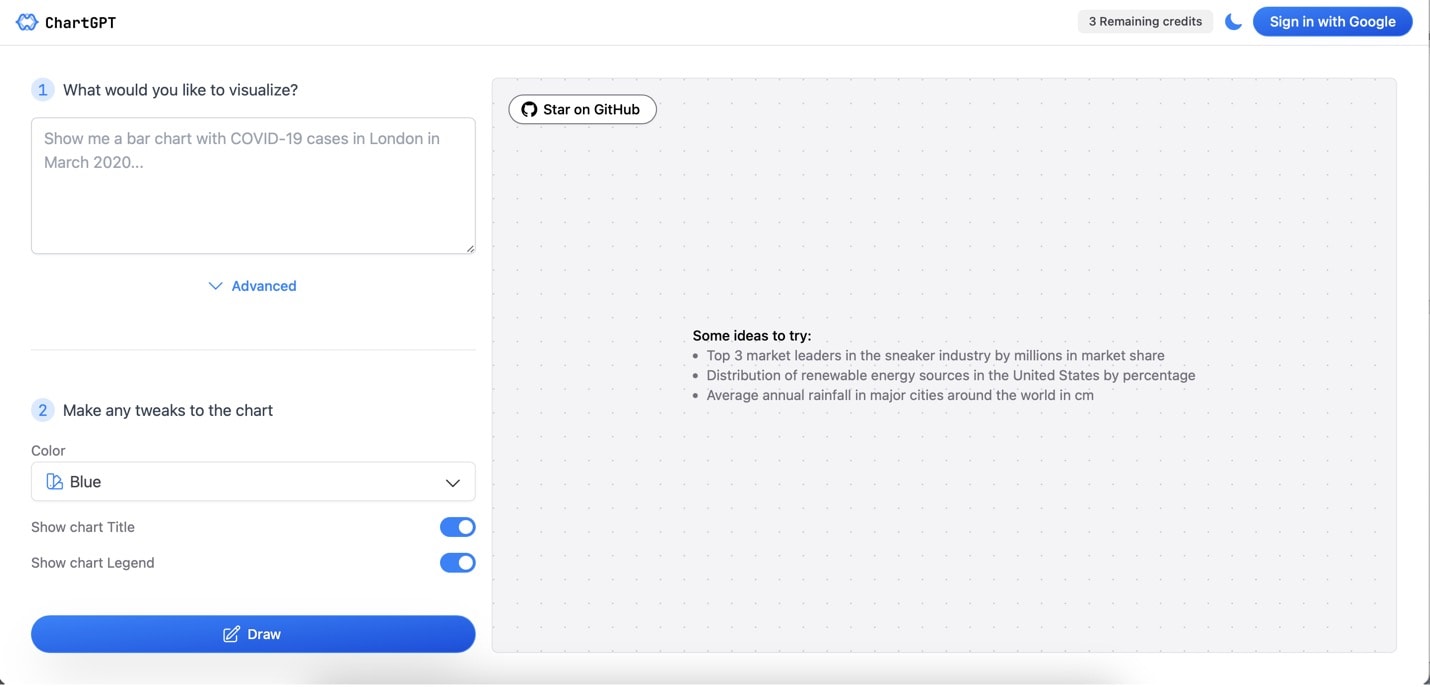
ChartGPT
ChartGPT is an open-source AI charting platform designed to create charts and graphs based on your text. It works by asking for the user’s needs, then searching for data to input into the graphs. It’s an easy way to visualize important data without the hassle of searching for them.
|
Pricing |
|
|
OS Availability |
|
|
Pros |
|
|
Cons |
|
Part 2. Maximizing AI Chart and Graph Generators
This section will explore helpful tips for getting the most out of AI chart and graph generators. These tools can make it easier to create visually appealing representations of data.
· Clear instructions: When using an AI chart and graph generator, it’s essential to give clear and specific instructions. Clearly explain what you want to show in the chart and the critical information you want to include. This will help the AI understand your needs and create more accurate charts.
· Review and customize: Even though AI algorithms can create charts automatically, you need to review and customize the results. Take the time to look at the generated chart and make any necessary changes. This ensures that the chart accurately shows the data and communicates your message effectively.
· Use relevant data: The quality of your visualizations depends on the data you provide. Make sure the data is accurate, complete, and relevant to what you want to analyze. Please clean up your data before using it to remove any mistakes or inconsistencies that could affect the charts.
· Choose the correct chart: Different data types need to be shown effectively. Understand your data and pick the right chart type that shows the relationships and patterns in the data. Consider how the data is spread out, what you want to compare, or any trends you want to show.
By following these tips, you can make the most of AI chart and graph generators to create clear and accurate visualizations that help you understand your data better.
Conclusion
In conclusion, AI chart and graph generators offer many advantages for creating impressive visualizations. They provide a user-friendly way to present data, regardless of your level of expertise. By following the provided tips, you can improve the accuracy and effectiveness of the charts you generate.
You are encouraged to explore the various chart generators available and discover how they can assist you with your needs. Consider giving Mockitt AI and its chart generator a try. It offers powerful capabilities for creating visually stunning charts. Start experimenting with these tools and unlock the potential of AI-driven visualizations for your data analysis and communication requirements.
