A Beginner's Guide to Creating Data Flow Diagrams (DFD)

Want to Create Data Flow Diagram? Try Now!
Wondershare Mockitt Flowchart Maker realizes easy & rapid flowchart diagram in minutes. Drag and drop to create wireframes and prototypes. Give it a try!
A data flow diagram is useful for understanding how a system functions more easily. It's a visual representation of the process; many people are visual learners. So it's recommended that you make one for the system you are building. Understandably, if you're new to data flow diagramming, you may find this task challenging. Don't worry; we got you. Here's a guide on how to create data flow diagrams.
- What is a Data Flow Diagram (DFD)?
- Benefits of Data Flow Diagram
- Main Elements and symbols of Data Flow Diagram
- Levels of Data Flow Diagrams
- How to Create a Data Flow Diagram?
- Data Flow Diagram Rules and Tips
What is a Data Flow Diagram (DFD)?
A data flow diagram is a visual representation of the flow of information through a system or process. It uses a standardized set of symbols and notations, making them easy to understand.
Besides the system, a DFD also provides information about the inputs and outputs of an entity. Therefore, a good data flow diagram is very informative.
One of the most noteworthy characteristics of a data flow diagram is that it does not have a control flow. You won't find decision rules and loops on one.
Benefits of Data Flow Diagram
A data flow diagram is a visual representation of processes and functions in a system. These capture, store, manipulate, and distribute data between a system and its environment. Likewise, they show how that goes with data between system components. That said, here are the main benefits of using a DFD:
- DFD, being a visual representation of those things, makes a good communication tool between the user and the System designer. That's especially true since the symbols and notations are standardized.
- You can establish manual and automated systems requirements with the information a data flow diagram can provide.
- You can determine physical system construction requirements.
Main Elements and symbols of Data Flow Diagram
A data flow diagram has 4 main elements: entity, process, data store, and data flow.
- Entity - external actors, sources or sinks, and terminators. They produce and consume the data flowing between the entity and the system. In other words, they are the sources and destinations of the data.
- Process - as the name suggests, this is the process that's occurring or the task being performed on the data. It is an activity that transforms or modifies the data flows.
- Data Store - this includes the system's database. Its function is not to generate any operations but to hold data for later use.
- Data Flow - these are data movements between entities, data stores, and processes.
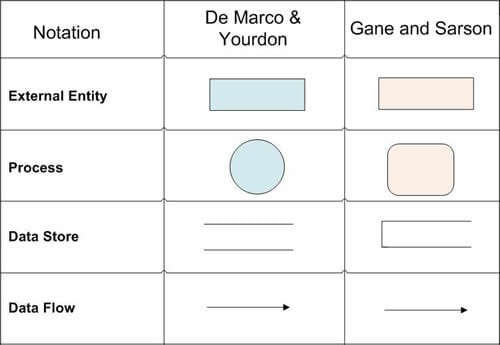
Data flow diagrams are universally understandable because each element uses a set symbol. They are:
- Entities - rectangles with names.
- Process - circles or sometimes round edge rectangles.
- Data Store - rectangles with one or both smaller sides missing.
- Data flow - arrows
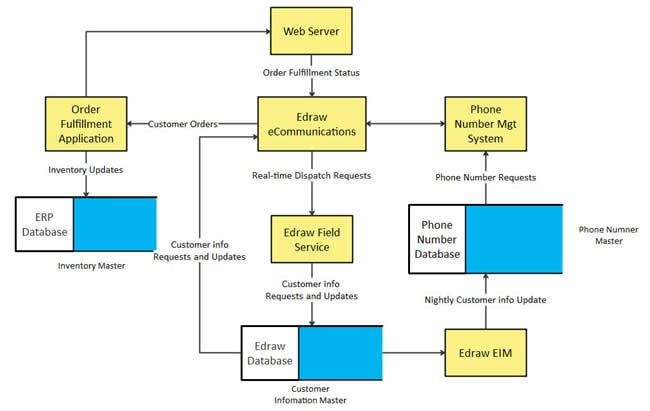
Levels of Data Flow Diagrams
You can make a data flow diagram at different levels. The higher the level, the more detailed it is. Needless to say, a high-level DFD looks more complex and harder to make.
Levels are labeled as 0-Level 0, 1-Level, 2-Level DFD, and so forth. Here, we will discuss levels 0 - 2.
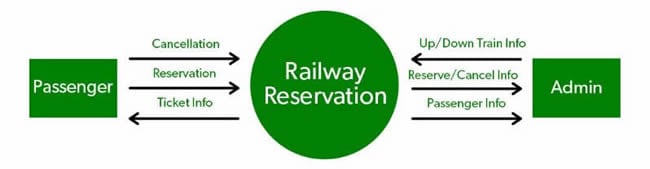
0-Level (context diagram) - the system is represented as a single bubble. It is surrounded by input and output data indicated by arrows (data flows).
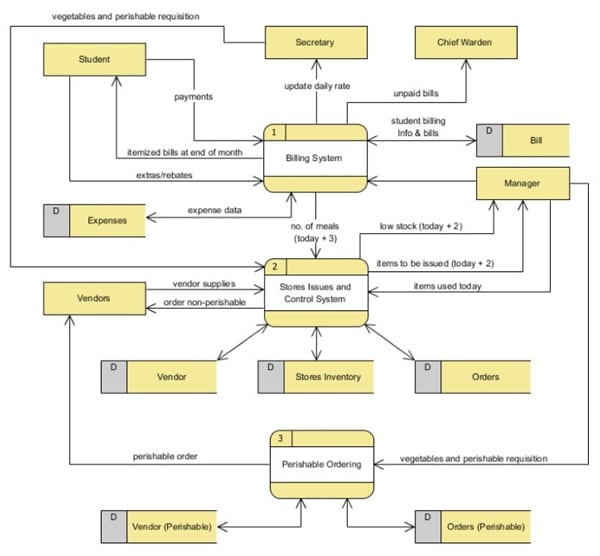
1-Level - multiple bubbles represent the system/processes. The main functions are highlighted, while the high-level processes of 0-Level DFD are broken down into sub-processes.
2-Level - it is like 1-Level DFD, but a little bit deeper. 2-Level DFD dives into the specific or necessary details about how the system functions.
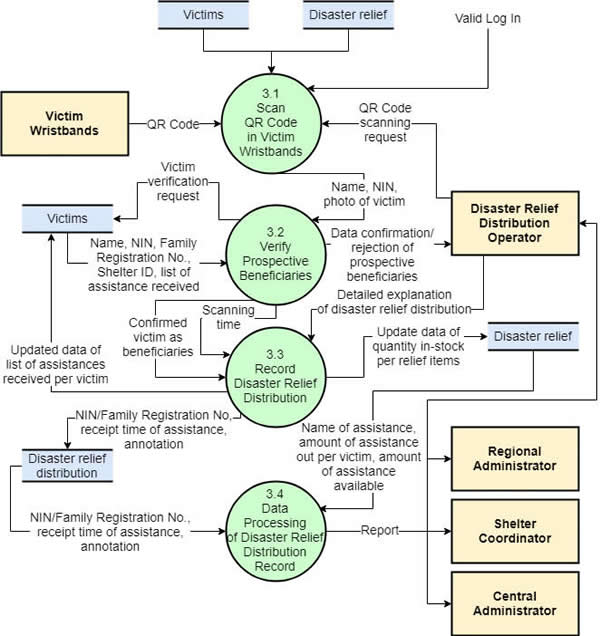
The takeaway is that as the level gets higher, more bubbles and arrows will be in the diagram.
How to Create a Data Flow Diagram?
You have now caught up in what a data flow diagram is, its usefulness, and the elements/symbols used in them. It is finally time for you to learn how to make one.
You can use different tools to make a DFD. Even the Paint app that comes pre-installed on Windows PCs is fine. However, we suggest using tools specializing in diagramming. You can use Wondershare Mockitt instead. It provides powerful design and diagramming tools that let you create DFDs that are easy to look at and understand.
Back to the steps for creating a data flow diagram:
Step 1: Select a system to make a diagram for.
Step 2: Identify all related activities. Categorize them into external entities, data flows, processes, and data stores.
Step 3: Create a 0-Level DFD for the system. Put your system in one bubble and add all the basic flows and connections. Label each element carefully.
Step 4: Review your work to check for things that are missing or inaccuracies. Fix the issues.
Step 5: Create new child diagrams for each process in your 0-Level DFD.
Step 6: Use the child diagrams you just made to turn the 0-Level DFD into a 1-Level DFD.
Step 7: Repeat the whole process as needed until you are satisfied.
Data Flow Diagram Rules and Tips
There are some key things that you need to remember when making a data flow diagram. This article will get you well-informed about them.
Rules:
- Every process should have at least one input and one output. There can never be an output if there is no incoming data.
- Each data store should have a minimum of one data flow in and one out.
- The process should not have more outputs than the sum of its inputs.
- All processes should link to another process or data store.
- The stored data in the system should go through a process.
- Give each data flow a name.
- Do not group disparate items into one data flow if there are not treated as a whole.
- Ignore initialization and termination.
Conclusion
Data flow diagrams look simple. But there's a lot to think about when making them. You have to follow a set of rules and use the right shapes and symbols for each element.
Data flow diagrams are iterative in nature. So, it's common for people to start over while doing an analysis. You should also be prepared to start from square one.
That said, using pen and paper is not the best approach. You would be wasting a lot of resources. Using tools like Wondershare Mockitt is recommended. It lets you create a data flow diagram and reiterate it very easily. Also, it provides you with a set of symbols you can use to make your DFD.
