Role of Data Analysis in Research and How It Works?

Data analysis in research fulfills an important part by summarizing the collected data. Data matters a lot for researchers and they rely on it. If there is any irrelevant data added to the research, it can be examined and even removed. The process of data analysis in research often shows the most unexpected stories that were not revealed while initiating data analysis. Many statistical procedures are involved in the analysis process where data is repeatedly collected and examined. Throughout the whole data collection phase, analyzation of patterns are usually observed by researchers. We will discuss the process to do data analysis in research further.
- Part 1: What is Data Analysis in Research?
- Part 2: How to Do Data Analysis in Research?
- Part 3: A Prototyping Software To Change Your Life
What is Data Analysis in Research?
Data analysis in the research proposal is defined as a process of modeling, cleaning, and changing data to discover useful information that will be profitable for business decision-making. The main reason for data analysis is to extract any kind of relevant information from available data and make decisions based on that data analysis. An example of data analysis can be taken as any decisions that we take in our life routine by keeping what happened before or what will happen if we select a specific decision. Those decisions are based on data analysis. Now you can apply the same method for business decisions with data analysis.
If you want to expand your business or take difficult decisions in practical life, all you need is analysis. If your business is going in a loss and not growing in the market, then you will have to do an analysis to find any mistakes and make a better plan keeping those previous mistakes and their circumstances in mind. And the same applies if your business is going in profits, then you will have to take a forward analysis and make your business more profitable. This process might be not easy but all you have to do is analyze the business data.
How to Do Data Analysis in Research?
We have already discussed the definition of data analysis in research above, now we will discuss the following steps of performing data analysis.

1. Gather Required Data
Before you go into the data analysis process, you will have to know the reason for the analysis. All you need is a purpose and goal of doing the analysis of available data. You will have to also decide which type of data analysis you will go with. In this phase, you also decide the object or data to analyze and ways to measure it, you should have a solid reason to investigate and what actions you will take to complete this analysis.
2. Collection of Data
Once you have gathered all the required data, you will have a clear view of the information you have to include and what should be the decisions. Now it's the phase to collect your data based on your business needs. Once you are done collecting data, keep in mind that the data collected should be organized and processed to be examined. As the data is gathered from different sources, it will be better to keep a record of the collection date and source of data.
3. Cleaning Irrelevant Data
Now you are done collecting data and some of the containing data might not be useful or relevant. You will have to focus on your aim of analysis and clean it. The compiled data may contain white spaces, bugs, or duplicate records. Collected data should be clean and free from errors. Make sure, this phase is completed before the analysis process because once you have cleaned your data, there will be more chances to gain a positive outcome from the analysis.
4. Data Analysis Process
Once you have gathered, processed, and cleaned the data, it will be good to go for analysis. As you start managing your data, you will find that you have the exact required information, or you may need more data for the best results. During this process, you can use tools and software for data analysis which helps to evaluate, understand, and obtains outcomes based on the requirements.
5. Obtained Data Interpretation
Once the analysis of data is done, you can now finally evaluate the results. There are many ways to display or express the data analysis, you can select the way which suits you the best such as a chart or a table. The obtained data analysis process results can be used in many ways. You can take your time and decide the best course of action to take.
6. Visualization of Available Data
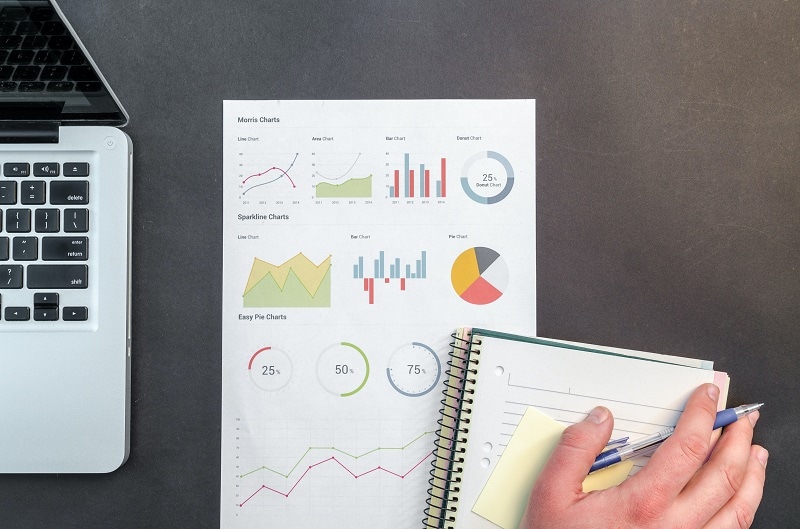
The phase of visualizing the data is very common and we encounter it in our regular routine. It is often available in the form of graphs, charts, and tables. The aim of displaying the data graphically so that it will be simplified and organized. This way the human brain can process the data easily. Data visualization is frequently used widely as it helps to discover the hidden trends and details. This may sound not so much use but if you observe relationships with data analysis in research methodology, you can find a lot of new meaningful data.
A Prototyping Software To Change Your Life
Wondershare Mockitt is a trending tool utilized for creating UI/UX designs. Digital professionals recognize and use this platform to create intuitive graphics. This prototyping tool allows the creation of process data graphs, tables, and charts. Even amateurs can operate this tool efficiently. Forget about writing a single line of code for a program.
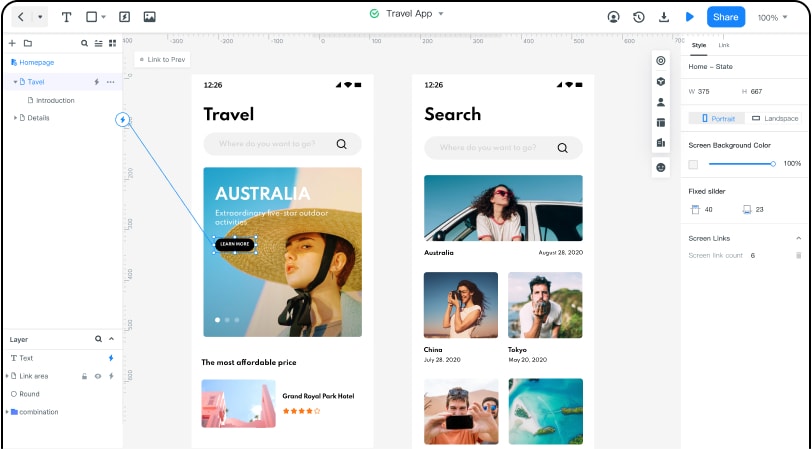
Wondershare Mockitt is a platform that supports many web developers with their managing and web projects. This is a perfect platform to get your big project related task performed cost-effectively and before the deadline. This tool allows its users to work in an organized and sleek environment. For ease of access, a quality pre-defined library full of built-in templates and UI assets is freely available.
Wondershare Mockitt also provides timeless collaboration. You can witness real-time changes made by the team members. It is a handy tool for designing multiple graphics. A list of custom-sized layouts with flexible drag and drop features is integrated by Wondershare Mockitt. The blending of object templates, add combos, and predefined widgets and icons are made easy. Users generate a QR code or URL and share their project details with clients and stakeholders and you can receive feedback on your current project progress. Ready to try it?
