Best Data Analysis Methods To Know in 2024

Data is no longer sparse in the Information Age, and it's overpowering. The key is to sift and accurately understand its consequences through the vast amount of data available to organizations and corporations. But you need the right statistical data processing software to work through all this stuff. Analysts have developed a number of fancy methods and strategies open to major companies with the latest fascination over "big data."
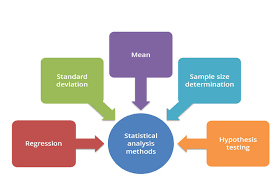
Five great data analysis methods
Before moving to more advanced methods, we recommend beginning your data analysis efforts with the following five basics and learning to avoid their pitfalls. Here are types of data analysis methods.
Mean
The arithmetical mean is the sum of a list of numbers separated by the number of things on the list, most generally referred to as the average. In evaluating the overall pattern of a data collection or having a short snapshot of your data, the mean is useful. Another value of the average is that it is very straightforward and easy to measure.
Shortcoming: The average is a risky instrument, taken alone. The mean is also closely connected to the mode and the median in certain data sets (two other measurements near the average). However, the average clearly does not have the precision you need for a complex judgment in a data collection with a high number of outliers or a biased distribution.
Standard Deviation
The standard deviation, which is also represented by the Greek letter sigma, is the estimate of the average data distribution. A high standard deviation means that data is more uniformly scattered from the mean, where a lower standard deviation implies that more evidence is associated with the mean. The standard deviation is useful in a portfolio of data processing tools for easily evaluating the dispersion of data points. Standard deviation is a particularly useful instrument in investment, and trading practices, as it allows to calculate and forecast output patterns in market and security fluctuations.
Shortcoming: Much as the median, if taken alone, the standard deviation is misleading. For e.g., if the data has a very odd trend, such as a non-normal curve or a huge number of outliers, then you won't get all the detail you need from the standard deviation.
Regression
The relationships between dependent and explanatory variables are modeled by regression, which is commonly charted on a scatter plot. The line of regression also determines whether these experiences are strong or weak. Regression is frequently taught to assess patterns over time in high school or college statistics classes with implications for science or industry. Regression analysis is a way to figure out which of such variables really has an effect mathematically. This answers the questions: Which variables are most important? Which are we able to ignore? How do those variables coordinate with each other? And most critically, maybe how certain are we of any of these variables?
Shortcoming: It is not quite nuanced for regression. The outliers on a scatter plot (and the explanations for them) often matter substantially. For instance, the feedback from your most important supplier or your best selling commodity could reflect an outlying data point. However, the existence of a regression line tempts you to forget these outliers.
Sample Size Determination
You don't necessarily need to obtain input from any individual of the group when calculating a broad data collection or population, like a workforce-a survey does the job just as well. For a sample to be valid, the trick is to decide the correct size. You are able to reliably calculate the proper sample size you need to make the data set statistically meaningful using proportion and standard deviation approaches. Sample size determination becomes very necessary when you are dealing with large-sized data, and there is more than one variable to be considered.
Shortcoming: The proportion calculations may need to depend on those assumptions when analyzing a new, untested variable in a population. Ses conclusions, though, may be entirely incorrect. This mistake is then applied to the determination of the sample size and then to the remainder of the statistical data analysis.
Hypothesis Testing
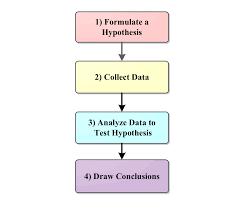
Hypothesis testing, more widely referred to as t testing, assesses whether a given premise about the data set or population is really accurate. You deem the outcome of a hypothesis test statistically important in data processing and statistics if the outcomes may not have occurred by random chance. Hypothesis checks are used in all fields, from scientific and analysis to business and economics. If you are trying to prove the relationship between some facets of the business, this is the best approach to use. You may argue, for instance, that less time spent on social media contributes to greater employee participation. But you need to try it to validate your case before you actually prohibit the use of social media at work.
Shortcoming: Theory tests have to look out for common mistakes in order to be rigorous. For starters, when participants mistakenly predict a certain outcome and then experience (or ultimately achieve) the outcome, the placebo effect happens. The Hawthorne effect (or observer effect), which arises when subjects bias outcomes when they know they are being observed, is another typical mistake.
Software for UX design
Wondershare Mockitt is an online platform for prototyping and sharing that lets you build immersive software wireframes and prototypes. By validating and executing the principle using this method, you will give life to your design concepts. Mockitt comes along with a lot of enjoyable stuff. This software is primarily intended for users who use UI UX designs and prototypes on a regular basis. This program comes with some capabilities that rivals can not offer, and for all the right reasons, we are here.

- Handover To Developer: To help get the team to the same page, Mockitt offers Handoff features that are a kind of marking tool. Commonly referred to as Handover to Developer, it helps planners, executives, and engineers to easily look up a particular feature and function effectively.
- Prototyping: Wondershare Mockitt's capabilities include prototyping that enables users to quickly develop immersive and animated prototypes, built-in, customized UI assets and quick prototyping models, and smooth teamwork collaboration.
- Libraries: Add more oomph to your projects and experiments with libraries along with basic functionality. For the development of ideal user-friendly UIs, these libraries come with interesting tools and models. For smoother prototyping, you can either use Mockitt's built-in libraries for assets and templates or build your own libraries to add customization to your projects.
