Data Analysis Tools You Need For Data Management

Many opportunities have been provided worldwide by the increasing demand and value of data analytics in the sector. As the open source solutions are more popular, user-friendly and performance-oriented than the pay edition, it becomes slightly difficult to shortlist the top data analytics tools. There are several open source applications that do not need much code and are able to achieve greater outcomes than paid ones, e.g. R programming in data mining and public Tableau, Python in data visualisation. Below is the ranking based on their success, learning and performance, of the top 10 data analytics software, both open access and paid versions.
The best 10 data analysis tools
1. R Programming
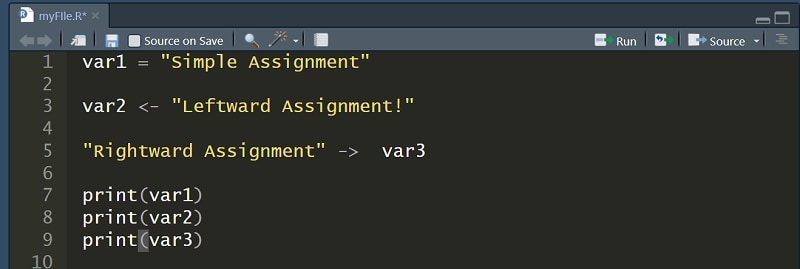
R is the industry's leading analytics platform and commonly used for statistics and data modelling. It can exploit the knowledge quickly and view it in various ways. In several respects, such as data capacity, efficiency and outcomes, it has surpassed SAS. R compiles and runs on a wide range of UNIX, Windows and MacOS systems. R also offers tools to instal all packages automatically according to user specifications, and can also be assembled well for Big Data.
2. Tableau Public
Tableau Public is a free app that links every source of data, be it corporate Data Warehouse, Microsoft Excel or web-based data, and generates web-based data visualisations, maps, dashboards, etc. with real-time alerts. If you want to see the strength of the tableau, then we need a very strong source of info. The Big Data capabilities of Tableau make them important and one can better interpret and visualise data than any other programme on the market for data visualisation.
3. Python
Python is an object-oriented programming language that is a free open source application that is easy to learn, write, update and maintain. It was developed in the late 1980s by Guido van Rossum to support both practical and formal methods of programming. As it is somewhat similar to JavaScript, Phython is simple to understand. Another significant feature of Python is that it can be assembled on any platform, such as a MongoDB database or JSON. Text data can also be managed very well by Python.
4. SAS
SAS was developed by the SAS Institute in 1966 and further developed in the 1980s and 1990s, and is a programming environment and language for data processing and a pioneer in analytics. SAS is easy to use, handle and can interpret information from any source. In 2011, SAS launched a vast range of customer intelligence products and various web, social media and marketing analytics SAS modules that are commonly used for profiling clients and prospects. It can also predict, control, and optimise their contact habits.
5. Apache Spark
Apache was founded by the University of California, Berkeley's AMPLab in 2009. Apache Spark is a fast, large-scale data processing engine, running programmes 100 times faster in memory and 10 times faster on disc in Hadoop clusters. Spark is based on data science and makes data science simple with its definition. A library-MLlib is also included in Spark, which offers a progressive range of computer algorithms for routine data science techniques such as sorting, regression, collective filtering, clustering, etc.
6. Excel
7. Rapid Miner
RapidMiner is a strong integrated data science application developed by the same business that, without any programming, conducts predictive analysis and other sophisticated analytics such as data mining, text analytics, deep learning and visual analytics. The tool is very efficient and can produce analytics based on settings for real-life data transformation, i.e. the formats and data sets can be managed for predictive analysis.
8. KNIME
The team of software engineers at the University of Konstanz founded KNIME in January 2004. KNIME is the leading platform for open source, reporting, and advanced analytics that helps you to analyse and model data through visual programming, combining multiple components through its scalable data pipelining concept for data mining and machine learning. Intuitive, transparent and constantly incorporating innovative technologies, KNIME allows it available to all to understand data and create data science workflows and interchangeable modules.
9. QlikView
QlikView has many special features, such as proprietary technologies, which has data processing in memory, which implements the result very easily for the end users and preserves the data in the report itself. The data association in QlikView is automatically retained and can be compressed from its original size to approximately 10 percent. Using colours, the data relationship is visualized-a particular colour is given to related data and another colour for non-related information.
10. Splunk
Splunk is a method for evaluating and searching for machine-generated data. Splunk pulls all text-based log data and offers a convenient way for a user to browse through it, pull all types of data and do all sorts of fascinating statistical research on it and display it in various formats. Splunk is a programme commonly used through a web-style interface to search, track and analyse machine-generated Big Data. Splunk conducts real-time data capture, indexing, and correlation in a searchable container from which graphs, reports, warnings, dashboards, and visualisations can be generated.
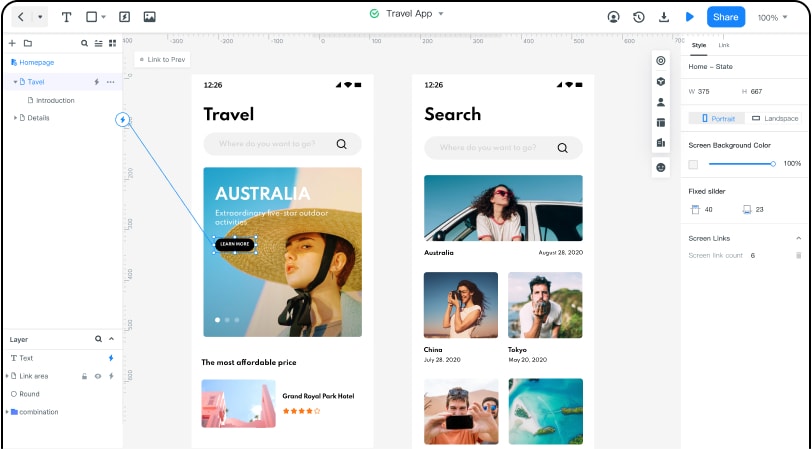
Software for UX design
Wondershare Mockitt is an online prototyping and networking platform developed for all operating systems as a cloud-based solution as well as desktop applications, helping to improve productivity and project execution by streamlined project co-editing and co-management. Mockitt argues are reasonably effective with a motto of scaling product thinking and promoting designing as a team. The online prototyping and networking platform contains impressive features such as:
- Prototyping: With its quick and simple gui, all you need is Mockitt to build immersive prototypes. With Mockitt, the happiness of your customer and the next major concept are only a few drag-and-drops away.
- Collaboration: With Wondershare Mockitt, you don't have to pass files to partners manually or send links to others in real-time to access, update, and comment on the projects. There's also a single-click sharing method to share projects with individuals outside the organisation. The idea that several entities can access and edit the same project collaboratively in real time makes it a perfect option for distributed teams that need smooth collaboration.
- Effective presentation and review: It helps you to present for greater comprehension with or without interface boundaries, whatever you and your customer fancy. Also if your client wishes to get hands-on experience with the design, instead of giving them the computer, you can share the design only through a QR code.
