Data Visualization in UX Discipline
Data visualization is a visual representation of arrays of various information. Data visualization turns big and small data into visuals that are easier for the human brain to understand and process. Data visualization is used across all industries: it is an important step in data analytics, enabling companies to evaluate information and audience requests critically.
There are several types of visualization:
1. A common visual representation of quantitative information in a schematic form. This group includes all the well-known pie and line charts, histograms and spectrograms, tables, and various dot plots.
2. The visualized data can be transformed into a form that enhances the perception and analysis of this information—for example, map and polar plot, timeline and parallel axis plot, Euler diagram.
3. Conceptual visualization allows you to develop complex concepts, ideas, and plans using concept maps, Gantt charts, shortest path graphs, and other similar types of charts.
4. Strategic visualization translates into visual form various data about aspects of the work of organizations. These are all kinds of diagrams of performance, life cycle, and graphs of the structures of organizations.
5. Metaphorical visualizations can help you graphically organize structural information using pyramids, trees, and data maps, of which the subway map is a prime example.
6. Combined visualization allows you to combine several complex graphs into one scheme, just like in a map with a weather forecast.

Why visualize data? / Importance of data visualization
In fact, 90% of the information entering the brain is visual. That is why data visualization is essential for many aspects.
Drive More Traffic
Visualized data drive more traffic to your website. People perceive and remember visual information better. In addition, looking at pictures and looking for relationships is quite exciting, which means that this way you will increase the time spent by users on the site, and, consequently, their involvement and loyalty to your company.
Easily Analyze Data
Analyze a large dataset and make statistics/reports. This is where visualization is most often used. For example, to calculate the company's profit for the year. It is much easier to come to a logical conclusion by looking at a graph.
Easy to understand
It is easy to explain complex things and phenomena. With the help of visualization, it is easy to replace entire chunks of text and highlight relationships. It's also just beautiful, so some infographics would be a great addition to your news or analytics portal or blog.
Other advantages of data visualization are
- quick and improved absorption of information and thus faster decisions;
- a deeper understanding of the next steps that need to be taken to improve the organization;
- an improved ability to keep the audience interested through easily understandable information;
- simplifying the process of sharing information so that as many people as possible have access to it;
- fewer data scientists need to be employed as the data is more accessible and understandable.
Common Uses for Data Visualization
Common areas of application for data visualization include:
1. Sales and marketing.
Digital marketing continues to be a growing market. Thus, marketing teams need to give close consideration to what in particular sources traffic is coming from. And how their resources are producing income on the web. Data visualization makes it simple to distinguish patterns and their connection to different marketing efforts.
2. Healthcare
Medical experts regularly use choropleth maps to visualize significant wellbeing information. A choropleth map shows partitioned geographic territories or districts that have been doled out a particular tone comparable to a mathematical variable. Choropleth maps allow healthcare professionals to perceive how a variable, for example, the passing rate from coronary illness, is changing in explicit zones.
3. Finance
Financial experts need to follow the exhibition of their interests to conclude whether to purchase or sell a resource or asset. Candlestick charts are utilized to make value developments and patterns obvious for financial experts by showing significant data like stocks, monetary forms, stocks, bonds, and items.
4. Science
Data visualization is not just used in computer science. Scientists and researchers regularly gather a lot of information, which frequently permits characteristics and relationships to be perceived from the start in their envisioned structure.
5. Politics
Data visualization plays a vital in politics. In politics, a wide range of data charts is utilized, particularly in elections. The circulation of seats in parliaments has appeared with pie graphs, benefits and losses with bar diagrams, the geological dispersion of voters with hued regions in guides, and elector movement with flowcharts.
6. Logistics
Data visualization is also used in logistics or shipping. Most shipping or logistics companies use different visualization tools to identify the best shipping or logistics routes.
5 Best data visualization tools in 2021
Nowadays, we have to deal with a huge amount of data. So it is important to comprehend the significance of this data and move to utilize the updated data visualization tool for the prospect. Data visualization tools help us to present data in a presentable manner. Data visualization tools help everyone from marketers to data scientists to sort raw data into classes and demonstrate results and processing through charts, graphs, videos, and more. Companies can use a variety of tools to visualize their data and information. Here, we listed the 5 most important data visualization tools that are very popular among big data professionals!
1. Power BI
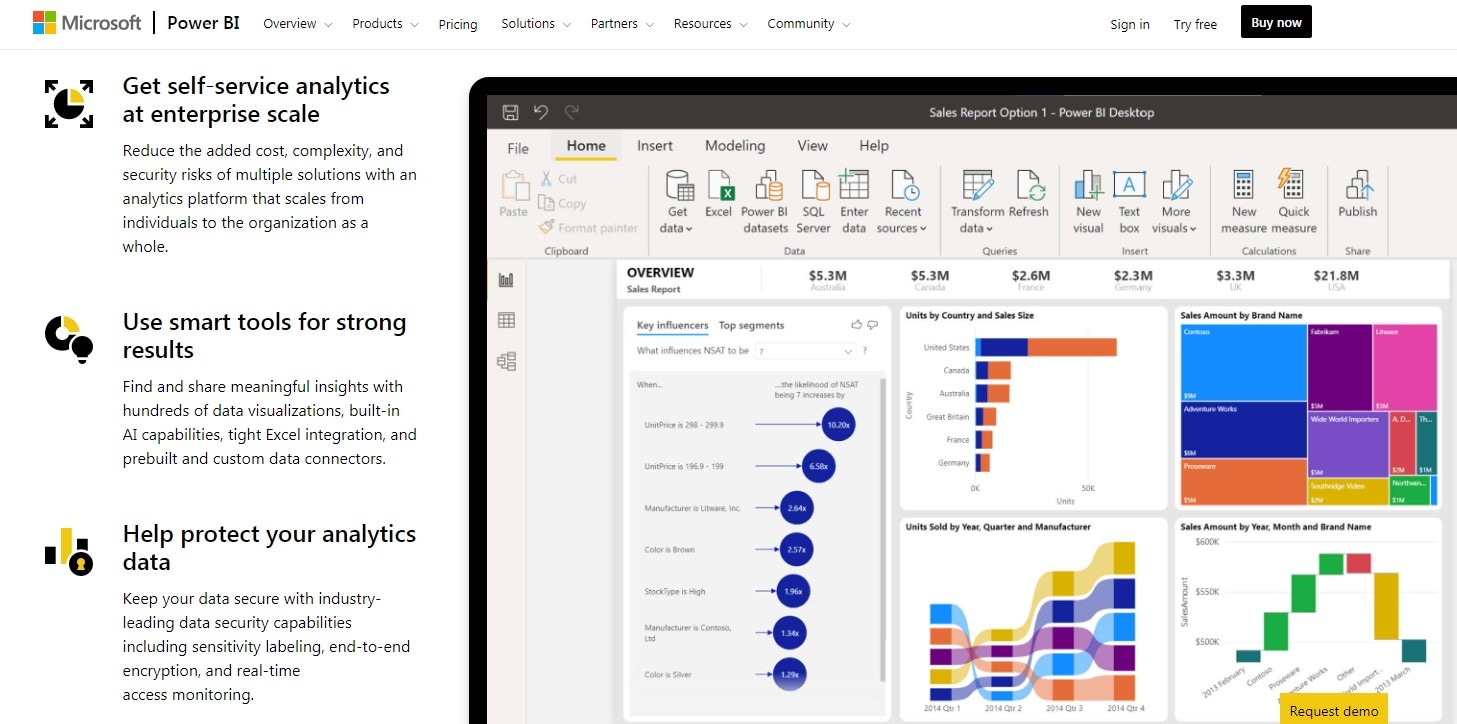
When it comes to the best data visualization tools, we cannot ignore Power BI - Microsoft. It is a data visualization and business intelligence tool. Power BI converts all the data obtained from different sources into reports and dashboards, making them easy to understand. Power BI can provide real-time updates on your report or dashboard. You can use its SaaS solution for easy report management. Power BI allows you to explore data through its "Natural Language Query" function. It is easy to use in a mixed configuration.
2. ChartBlocks
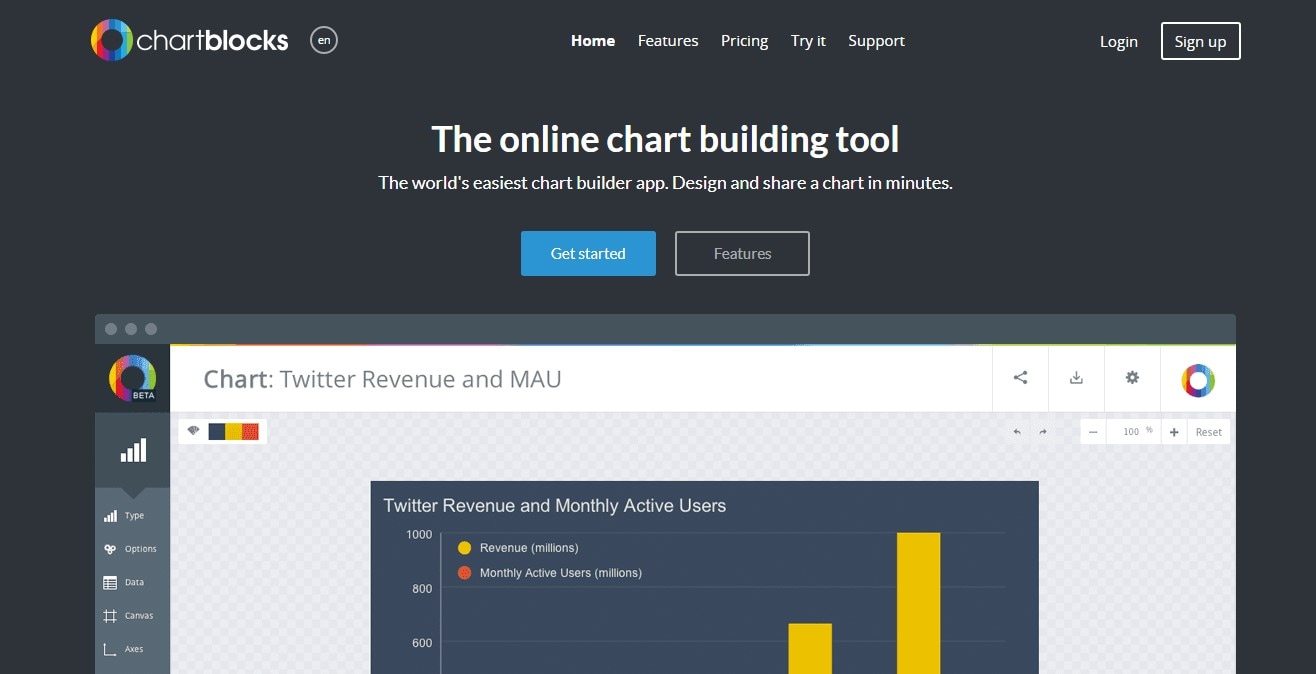
ChartBlocks is an innovative data visualization software that allows you to import data in a fraction of a second. ChartBlocks is best suited for the travel, healthcare, insurance, and retail industries. Moreover, you can immediately update your data in the ChartBlocks app and perform the necessary imports. It also comes with a "Chart Builder" to help you create the type of chart you want. Has a certain high level of complexity of tools. After that, you can easily embed charts on your website or any other social network.
3. Zoho Analytics
Zoho Analytics is probably one of the most popular business intelligence tools on this list. The only thing you can be sure of is that with Zoho Analytics, you can upload your data securely. What's more, you can use a wide variety of charts, tables, and components to transform your data into a condensed form. Zoho Analytics primarily serves large businesses, including Bajaj Allianz, Maruti Suzuki, HP, and Hyundai Motors. However, it is also suitable for medium-sized businesses.
4. Plotly
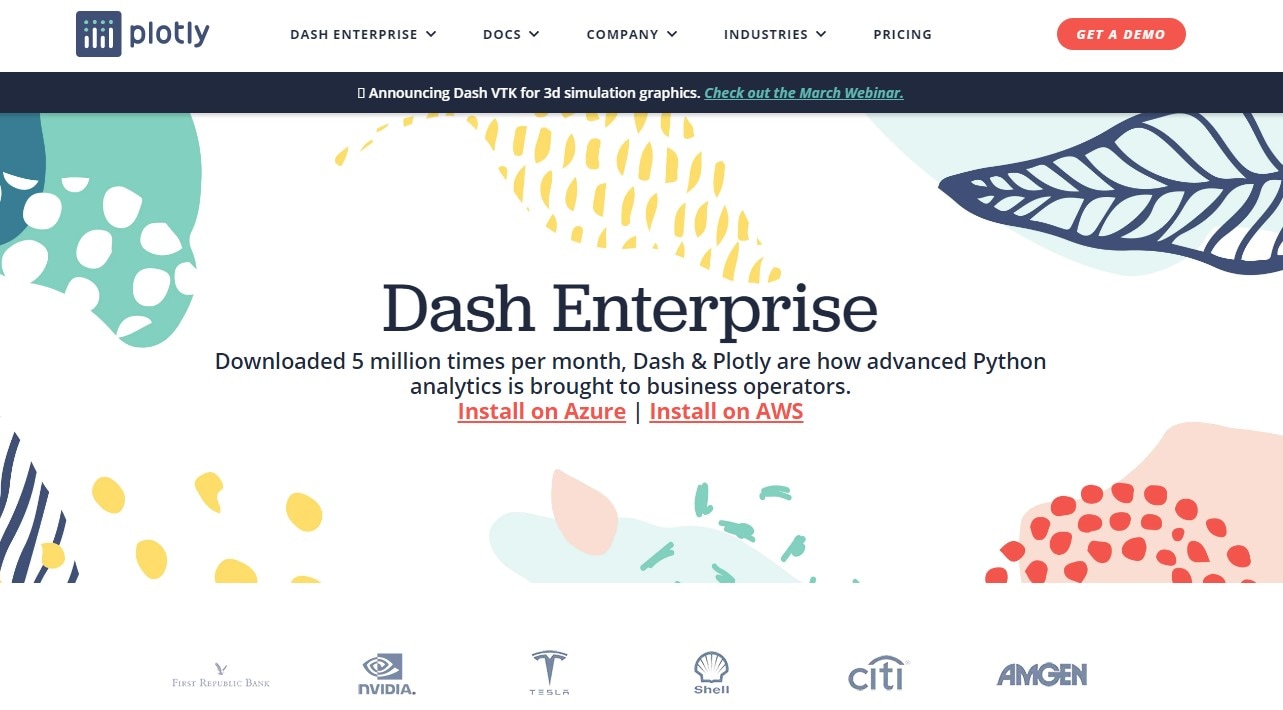
Plotly not only helps you create charts but also provides detailed analytics reports to help you track data. It also has an easily customizable user interface. Plus, it helps you export reports easily and works great in the business intelligence area. Plotly has commercial offerings such as Dash Enterprise and Chart Studio Enterprise. Hence, it is more suitable for professional expert teams that require large-scale data science and AI applications. Also, it is ideal for both students and small businesses.
5. Google Charts
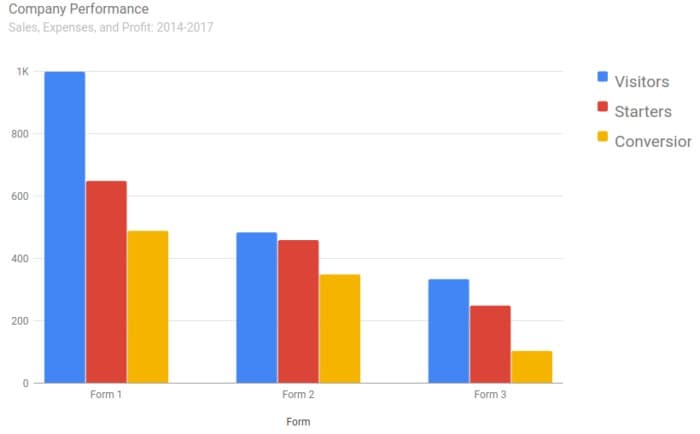
Google Charts, a cloud-based data visualization tool, can easily create interactive graphic charts by automatically processing information provided by users. No matter what you want, whether it is a simple line chart or a complex line chart, it works well. I come with a gallery with many interactive charts. It is compatible with various web browsers. It allows you to connect to data in real-time. Google Charts works well on iOS and Android platforms.
The relationships between Data Visualization and UX.
Data visualization also plays a vital role in UX design. Nowadays, UX designers use more data than before. And it helps amazingly while developing the product. However, UX designers need to guarantee that they get real and useful insights from the different data visualization tools. Data visualization can assist UX designers in understanding patterns over the long run and find design solutions based on facts. Data visualization can work for UX Designers in two ways:
Data visualization can help in the design process: UX Designers collect and collate data to improve the design and development of a product. E.g., UX reports
UX Designers gather and collate data to improve the design and development of the product. E.g., UX reports
Data visualization can enhance the user experience: UX Designers design interfaces/web pages that will allow users to visualize real-time data. For example, a dashboard.
Once data is visualized and contextualized into journey maps, infographics, and chart form, the UX designer can build a prototype. Many online tools allow you to incorporate real user data into your prototypes!

