How to Use Microsoft Excel and Its Tools to Analyze Data
Everyone has used Microsoft office and the excel analysis tools that come with it. You probably have experienced the stress of selecting an incorrect formula for analyzing a data set. We cannot deny that we have worked on it for hours and finally gave up because the functions were too complex or the data output was wrong. At this point, you preferred to analyze the data manually.
Excel analysis tools and functions are hundreds in number, and it can be confusing from time to time trying to match the right formula with the right data. The functions that are the most useful are not so complicated.
- Part 1: What're The Data Analysis Functions in Excel?
- Part 2: How to Do Data Analysis Using Excel
- Part 3: A Reliable Prototyping Tool for all Professionals
What're The Data Analysis Functions in Excel?
1. CONCATENATE Function
=CONCATENATE is one of the excel analysis functions that are easiest to learn and most powerful to use in data analysis. You can combine numbers, dates, text, and more data from multiple to one cell. If you are looking forward to creating product SKUs, API endpoints, and JAVA queries. Its formula is: =CONCATENATE (Cells You Want to Combine)

2. LEN Function
=LEN is a function that specifies the number of characters instantly in a given cell. If you want to identify two different types of product stock keeping units (SKUs). Use =LEN formula to see the characters number in a cell. If you are adding data analysis to excel then you can use LEN to determine the differences in Unique Identifiers (UIDs). Its formula is: =LEN (Select Cell)
3. COUNTA Function
=COUNTA is a function that identifies if your cell is empty nor not. If you are working as a data analyst, you will be facing incomplete sets of data daily. COUNTA will be your companion along the way to assess any gaps in a data set without rearranging the data. Its formula is: =COUNTA (Select Cell)
4. AVERAGEIFS Function
This function is similar to SUMIFS, this function allows the user to evaluate an average based on one or more criteria. Its formula is: =AVERAGEIF (Select Cell, Criteria,[Average Range])

How to Do Data Analysis Using Excel
If you want to do data analysis using excel, you can use the Pivot tool in excel to summarize a huge amount of data. If you understand and recognize patterns within the data sets, you can analyze data and excel in a reliable way. The process of recognizing patterns in Microsoft excel data analysis and business modeling is very simple. But the size of datasets often needs additional attempts to find the patterns. If you use a Pivot Table in this case, it will be a great advantage and will save you time by summarizing groups of data in a few minutes.
You can summarize various types of data with a Pivot Table such as sums, counts, and averages in excel from data stored in a different table or spreadsheet. It is a great trend analysis excel for instantly creating reports because data is visualized and sorted quickly. A spreadsheet may be needed for a data analysis example, that allows you to copy and paste data into excel, or you can use Google Docs (click File > Create a Copy). The spreadsheet contains information about the company's customer shopping information. Since the purchasing dates will be different, a Pivot Table will assist to summarize the data to see the totals products sold and compare purchases with other brands and competitors for a quick analysis.
You can depend on the Pivot table as it allows rearranging the table and keeps only necessary data. Use Excel for statistical analysis and create a Pivot Table.
- You first have to select cells you want to include in the table and start from
- Select and insert a Pivot Table
- Now select the data you want to analyze, select a table or range
- In Table/Range option, confirm the cell range
- Select where you want your Pivot Table report to be placed, select an existing or a new worksheet, then select the location on the worksheet where Pivot Table will appear.
- At the end Click OK

There are many ways to analyze data by creating different types of charts, column charts, and mini graphs. Users can apply a table style, Pivot Table, instantly insert totals and different formatting options. You can follow these steps to analyze data in Excel.
- First, you have to select the cells you want to analyze for data
- Select the quick analysis option that is to the bottom right of the selected data or you can just press CTRL + Q
- Selected data will be visible with the quick analysis button
- Select the tab you want to see your data in from the In the Quick Analysis gallery
- Select an option or drag the cursor to each one to see a preview
- Options selected are not the same as always. This depends on the type of data you have selected first from your workbook
To recognize the best way to analyze available data in excel, you need to take some time and select the analysis option that suits you the most such as formatting, charts, tables, totals, and sparklines.
A Reliable Prototyping Tool for all Professionals
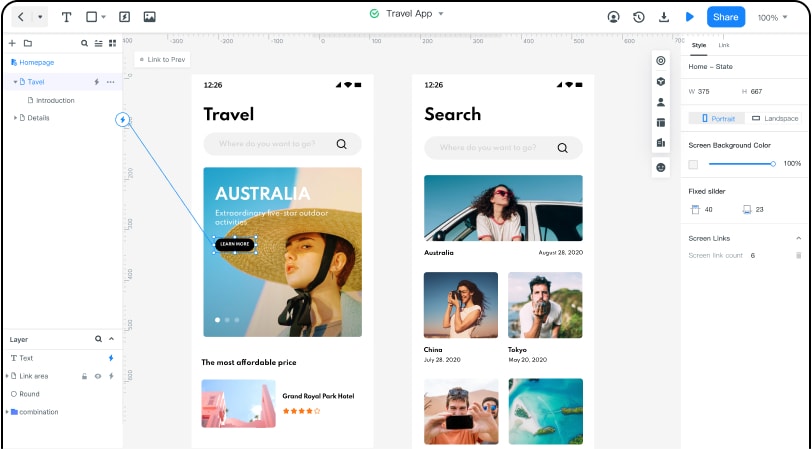
Wondershare Mockitt helps digital workers by providing many features free of cost. Professionals recognize and utilize this platform to create intuitive graphics. This prototyping tool enables users to create a variety of process data graphs, tables, and charts. Beginners can operate this tool efficiently and cost-effectively. Skip the hectic work of writing a single line of code. Wondershare Mockitt encourages many web developers with their designing and web projects. This is a perfect platform to get your important project related task performed before the deadline. You can be more creative if work in an organized and sleek environment that is available on this platform. As a bonus, a quality pre-defined library full of built-in templates and UI assets is ready on the go.

Wondershare Mockitt also gives an advantage of timeless collaboration. You can witness real-time changes made by the team members during the project. A list of custom-sized layouts with flexible drag and drop features is integrated by Wondershare Mockitt. Blend various object templates, add combos, and predefined widgets and icons easily. Users generate a QR code or URL and share their project details with clients and stakeholders and you can receive feedback on your current project progress. Do try it today!

