Guide:AI Advanced Components
Discover the advanced capabilities of Mockitt AI with our comprehensive guide on using the Flowchart, Mind Map, Table, and Chart Generator. From creating intuitive flowcharts to organizing ideas with mind maps, designing dynamic tables, and visually presenting data with charts, this guide provides step-by-step instructions to help you harness the full potential of Mockitt AI’s advanced features.
Elevate your prototyping game and bring your ideas to life with these versatile and efficient tools. Follow the guide below to learn more.
Step 1: Getting Started With Mockitt
Sign in to your Mockitt account or create a new one. Once logged in, click New and choose from the available options to start a new project. Next, select the desired device type (e.g., mobile, tablet, web) and set the screen dimensions. You will then be redirected to your artboard, where you can access Mockitt AI’s advanced components.

Step 2: Access Mockitt AI’s Advanced Components
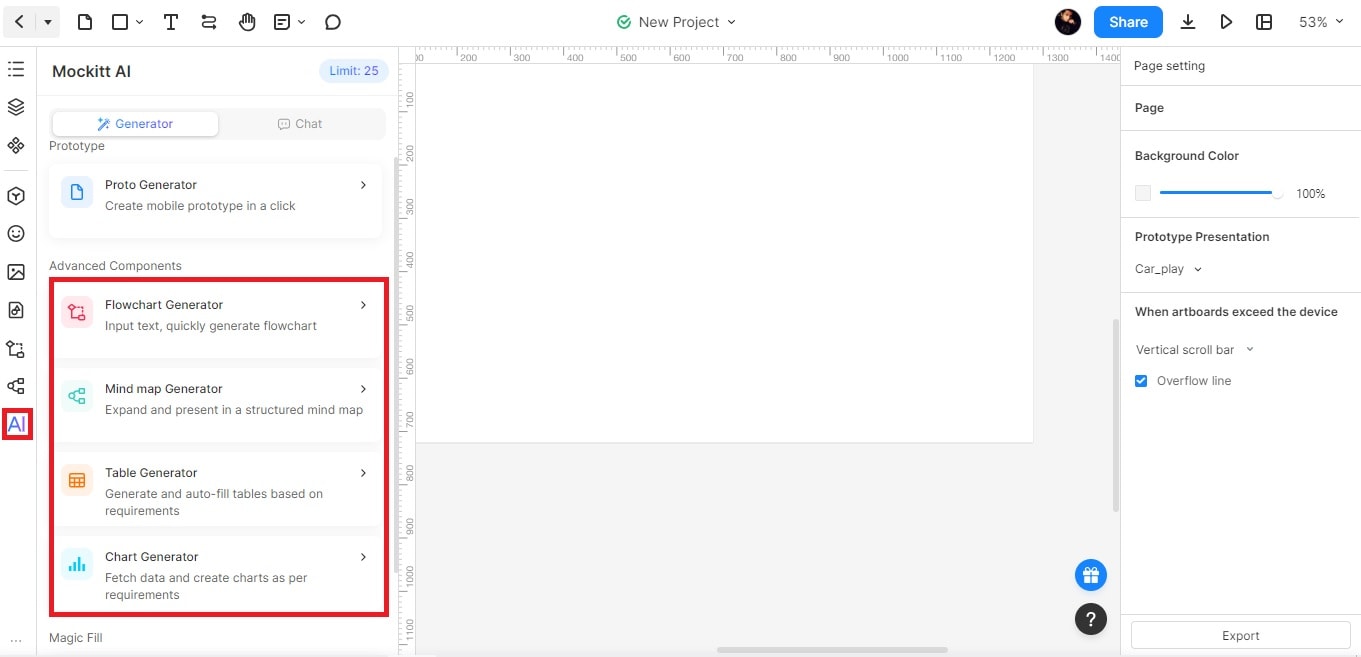
On the left panel, click on the AI button. You will find Mockitt AI’s Advanced Components, such as the Flowchart, Mind Map, Table, and Chart generators. Choose your preferred component. A dialog box will pop up where you can type in a prompt according to your needs. Alternatively, you can select from the example prompts below the chat box to instantly get the desired results.
Step 3A: Using the Flowchart Generator
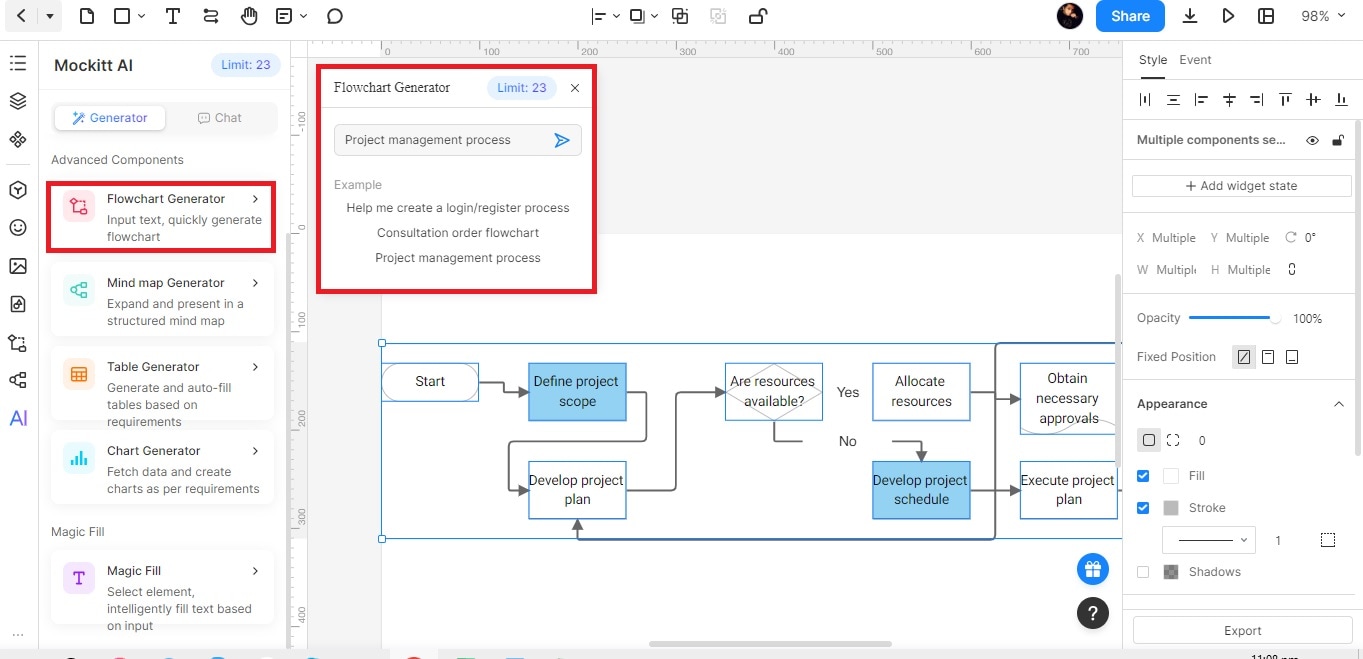
Click on the Flowchart Generator to quickly create a flowchart using Mockitt AI. Use the toolbar to add shapes, connectors, and labels. In addition, you can modify the colors, fonts, and line styles as needed using the right panel. Connect shapes using drag-and-drop or by using connectors.
Step 3B: Creating Mind Maps Using the Mind Map Generator
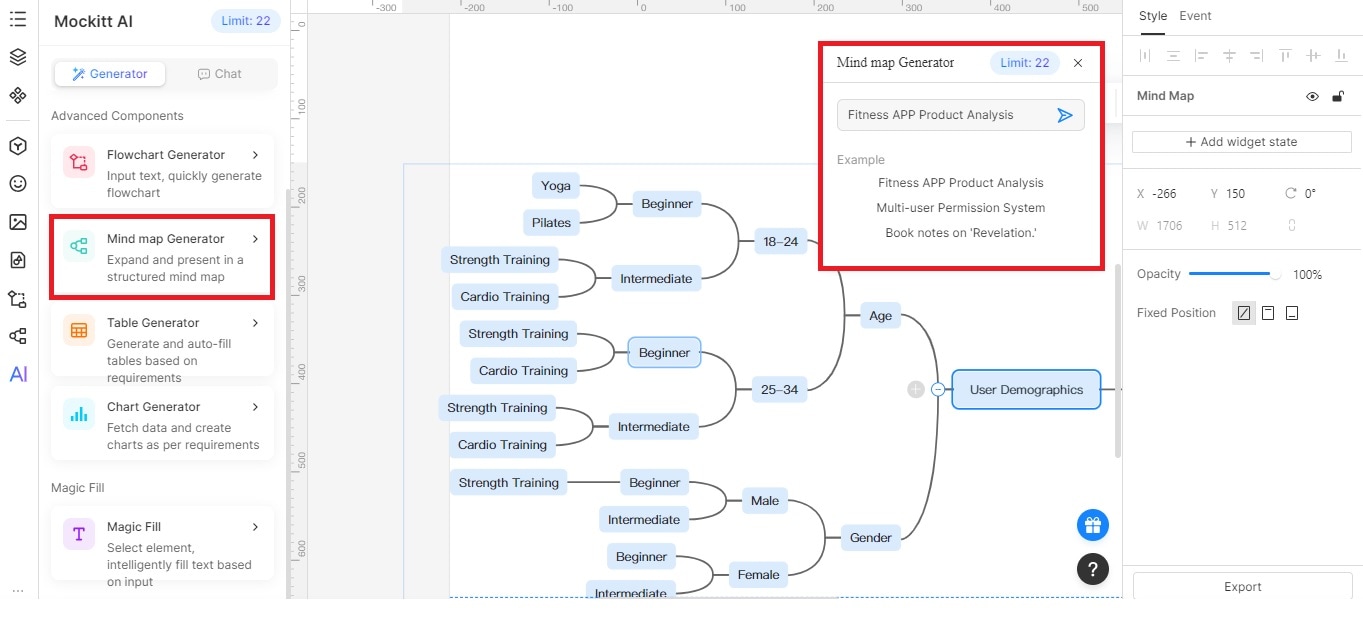
Click on the Mind map Generator to instantly generate a mind map. Use the toolbar to add branches, sub-branches, and labels. The right panel allows you to customize colors, fonts, and line styles. Drag and rearrange the branches to create your desired hierarchy.
Step 3C: Generate Tables Using the Table Generator
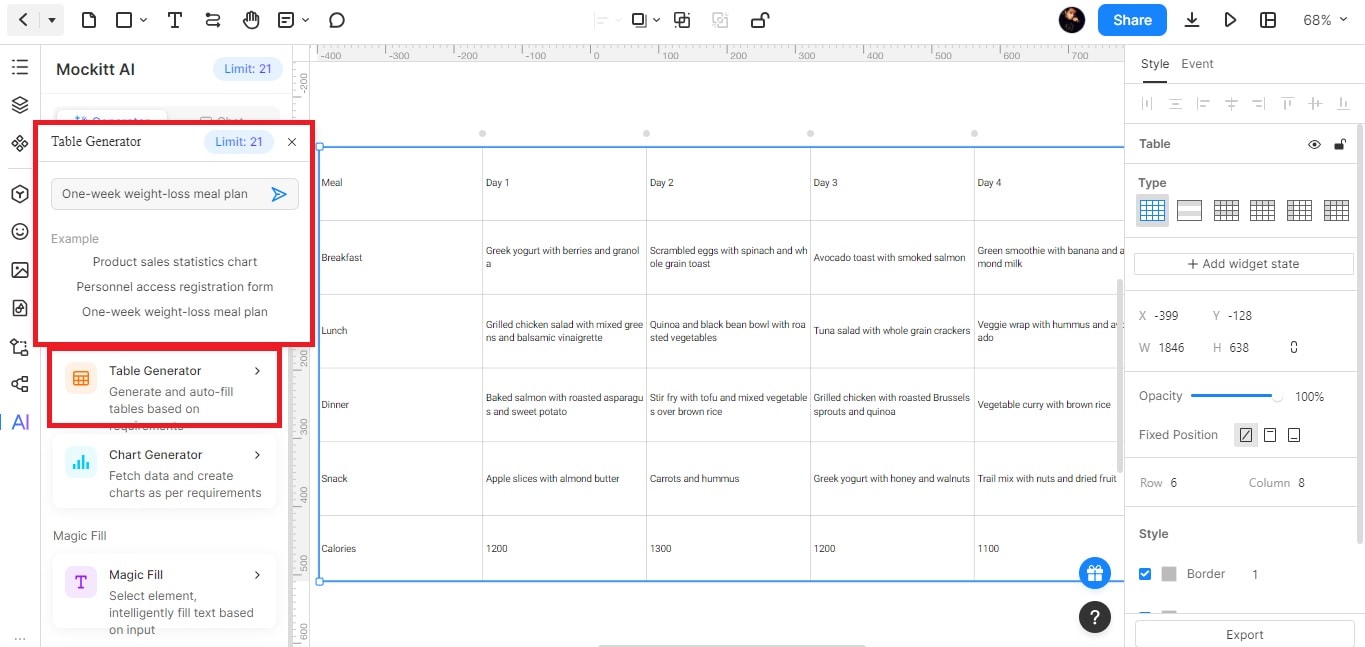
Click the Table Generator to auto-fill tables based on your requirements. Next, use the toolbar to add rows, columns, and content. Edit the table appearance by adjusting the colors, fonts, borders, and cell properties. Enter data into the table cells.
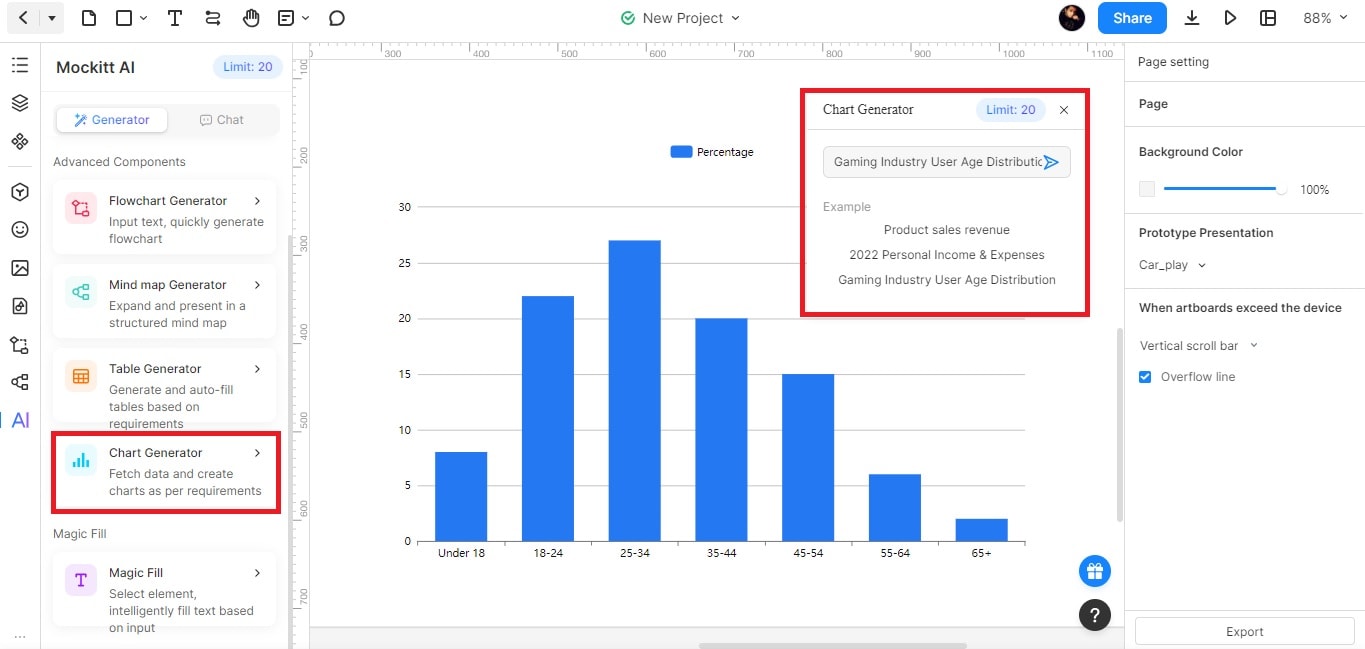
Step 3D: Fetch Data with the Chart Generator
Lastly, click on the Chart Generator to create charts based on your requirements and fetch data in seconds. Choose the desired chart type (e.g., bar chart, line chart, pie chart). Enter or import the data into the chart editor. You can customize the chart’s appearance by including colors, labels, legends, and axes.
Step 4: Customize and Configure Components
Review your AI-assisted project. Make sure to perform adjustments to personalize your content. Fine-tune the design, layout, and interactions, whether your content is a flowchart, mind map, table, or chart. When you finish editing your project, click on the Preview button to test the functionality of your advanced components. Share it with team members or stakeholders for feedback by clicking on the Share button and generating a shareable link.